Basic Transformations on Graphs
Drawing the graph of y = f(x) + b, b ε R, from the known graph of y = f(x)
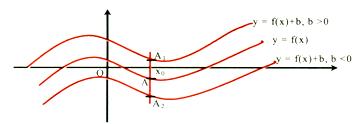
 It is obvious that domain of f(x) and f(x) + b are the same. Let us take any point x0 in the domain of f(x). y|x=x0 = f(x0).
The corresponding point on f(x) + b would be f(x0) + b.
For b > 0 => f(x0) + b > f(x0) it means that the corresponding point on
f(x) + b would be lying at a distance 'b' units above point on f(x).
For b > 0 => f(x0) + b < f(x0) it means that the corresponding point on
f(x) + b would be lying at a distance 'b' units below point on f(x).
Accordingly the graph of f(x) + b can be obtained by translating the graph of f(x) either in the positive y-axis direction (if b > 0) or in the negative y-axis direction (if b < 0), through a distance |b| units.
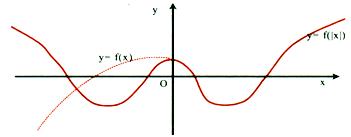
Drawing the graph of y = |f(x)| from the known graph of y = f(x)
|f(x)| = f(x) if f(x) > 0 and |f(x)| = -f(x) if f(x) < 0. It means that the graph of f(x) and |f(x)| would coincide if f(x) > 0 and the portions where f(x) < 0 would get inverted in the upwards direction.
The above figure would make the procedure clear.
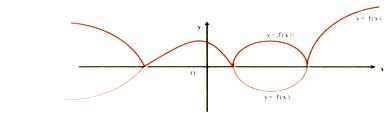
Drawing the graph of y = f(|x|) from the known graph of y = f(x)
It is clear that, f(|x|) = ![]()
Thus f(|x|) would be a even function. Graphs of f(|x|) and f(x) would be identical in the first and the fourth quadrants (as x > 0) and as such the graph of f(|x|) would be symmetrical about the y-axis (as (|x|) is even).
The figure would make the procedure clear.
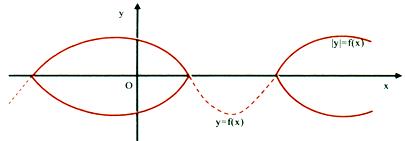
Drawing the graph of |y| = f(x) from the known graph of y = f(x)
Clearly |y| > 0. If f(x) < 0, graph of |y| = f(x) would not exist. And if
f(x) > 0, |y| = f(x) would give y = + f(x). Hence graph of |y| = f(x) would exist only in the regions where f(x) is non-negative and will be reflected about the x-axis only in those regions.
Drawing the graph of y = f(x + a), a ε R from the known graph of y = f(x)
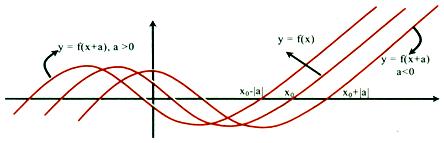
Let us take any point x0 ε domain of f(x), and set x + a = x0 or x = x0 - a.
a > 0 => x < x0, and a < 0 => x > x0. That mean x0 and x0 - a would given us same abscissa for f(x) and f(x + a) respectively.
As such, for a > 0, graph of f(x + a) can be obtained simply by translating the graph of f(x) in the negative x-direction through a distance 'a' units. If a < 0, graph of f(x + a) can be obtained by translating the graph of f(x) in the positive x-direction through a distance a units.
Drawing the graph of y = a f(x) from the known graph of y = f(x)
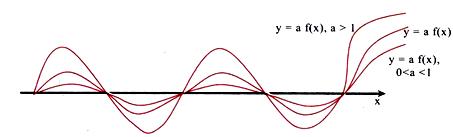
It is clear that the corresponding points (points with same x co-ordinates) would have their ordinates in the ratio of 1 : a.
Drawing the graph of y = f(ax) from the known graph of y = f(x)
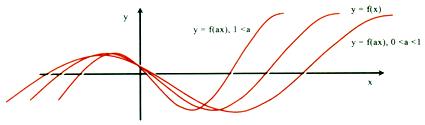
Let us take any point x0 ε domain of f(x). Let ax = x0 or x = x0/a.
Clearly if 0 < a < 1 then x > x0 and f(x) will stretch by 1/a units against the y-axis, and if a > 1, x < x0, then f(x) will compress by a units against the y-axis.
Drawing the graph of y = f-1(x) from the known graph of y = f(x)
For drawing the graph of y = f-1(x) we have to first of all find the interval in which the function is bijective (invertible). Then take the reflection of y = f(x) (within the invertible region) about the line y = x. The reflected part would give us the graph of y = f-1(x).
e.g. let us draw the graph of y = sin-1 x. We know that y = f(x) = sin x is invertible if f : [-∏/2, ∏/2] → [-1, 1], => the inverse mapping would be f-1 : [-1, 1]→[-∏/2, ∏/2].
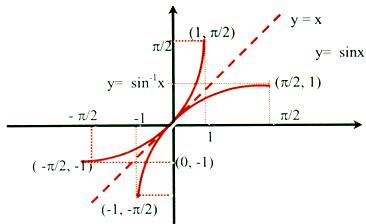
Illustration: Draw the graph of f(x) = cosx cos(x + 2) - cos2(x + 1).
Solution : f(x) = cox cos(x + 2) - cos2(x + 1)
1/2 [cos(2x + 2) + cos 2]
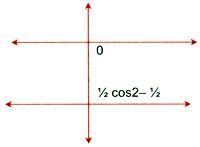
-(1/2)[cos(2x + 2) + 1]
= (1/2) cos 2 -(1/2) < 0.
IIT JEE study material is available online free of cost at askIITians.com. We offer numerous live online courses, online tests and other interesting sections as well for IIT JEE preparation - you do not need to travel anywhere any longer - just sit at your home and study for IIT JEE live online with askIITians.com
To read more, Buy study materials of Set Relations and Functions comprising study notes, revision notes, video lectures, previous year solved questions etc. Also browse for more study materials on Mathematics here.
View courses by askIITians


Design classes One-on-One in your own way with Top IITians/Medical Professionals
Click Here Know More

Complete Self Study Package designed by Industry Leading Experts
Click Here Know More

Live 1-1 coding classes to unleash the Creator in your Child
Click Here Know More
