Chapter 32: Statistics – Exercise 32.7
Statistics – Exercise – 32.7 – Q.1
We observe that the average monthly wages in both firms is same i.e. Rs. 2500. Therefore the plant with greater variance will have greater variability.
Thus plant B has greater variability in individual wages.
Statistics – Exercise – 32.7 – Q.2
We observe that the average weights and heights for the 50 students is same i.e. 63.2.
Therefore, the parameter with greater variance will have more variability.
Thus, height has greater variability than weights.
Statistics – Exercise – 32.7 – Q.3

So, we have:
.png)
Statistics – Exercise – 32.7 – Q.4
| CI | f | x | u = (x – A)/h | fu | u2 | fu2 |
| 1000 – 1700 | 12 | 1350 | -2 | -24 | 4 | 48 |
| 1700 – 2400 | 18 | 2050 | -1 | -18 | 1 | 18 |
| 2400 – 3100 | 20 | 2750 | 0 | 0 | 0 | 0 |
| 3100 – 3800 | 25 | 3450 | 1 | 25 | 1 | 25 |
| 3800 – 4500 | 35 | 4150 | 2 | 70 | 4 | 140 |
| 4500 – 5200 | 10 | 4850 | 3 | 30 | 9 | 90 |
| 120 | 83 | 321 |
Here,

Statistics – Exercise – 32.7 – Q.5
(i) Total wages paid by firm A = (Average wages) × (Number of employees)
= 52.5 × 587 = Rs 30817.50
Total wages paid by firm B = (Average wages) × (Number of employees)
= 47.5 × 648 = Rs 30780
So, firm A pays higher total wages,
(ii) In order to compare the variability of wages among the two firms, we have to calculated their coefficients of variation.
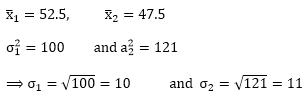
Let σ1 and σ2 denote the standard deviations of Firm A and Firm B respectively. Further,
let be the mean wages in firms A and B respectively.
We have,
Now,
Coefficient of variation in wages in firm
.png)
and,
Coefficient of variation in wages in firm
.png)
Clearly, coefficient of variation in wages in greater for firm B than for firm A.
So, firm B shows more variability in wages.
Statistics – Exercise – 32.7 – Q.6
In order to compare the variability of weight in boys and girls, we have to calculate their coefficients of variation.
Let σ1 and σ2 denote the standard deviations of weight in boys and girls respectively. Further,
letbe the mean weight of boys and girls respectively.
we have,
.png)
Now,
Coefficient of variation in weights in boys
.png)
and,
Coefficient of variation in weights in girls
.png)
Clearly, Coefficient of variation in weights is greater in boys than in girls.
So, weights shows move variability in boys.
Statistics – Exercise – 32.7 – Q.7
In order to compare the variability of marks in Math, Physics, and Chemistry, we have to calculate their coefficients of variation.
Let σ1, σ2 and σ3 denote the standard deviations of marks in Math, Physics and chemistry respectively.
Further, let be the mean scores in Math, Physics and Chemistry respectively.
We have,
.png)
Now,
Coefficient of variation in Maths
.png)
Coefficient of variation in Physics
.png)
Coefficient of variation in Chemistry
.png)
Clearly, Coefficient of variation in marks is greatest in Chemistry and lowest in Math.
So, marks in chemistry show highest variability and marks in maths show lowest variability.
Statistics – Exercise – 32.7 – Q.8
Let's first find the cofficient of variable for Group G1
| CI | f | x | u = (x - A)/h | fu | u2 | fu2 |
| 10 – 20 | 9 | 15 | -3 | - 27 | 9 | 81 |
| 20 – 30 | 17 | 25 | -2 | - 34 | 4 | 68 |
| 30 – 40 | 32 | 35 | -1 | - 32 | 1 | 32 |
| 40 – 50 | 33 | 45 | 0 | 0 | 0 | 0 |
| 50 – 60 | 40 | 55 | 1 | 40 | 1 | 40 |
| 60 – 70 | 10 | 65 | 2 | 20 | 4 | 40 |
| 70 – 80 | 9 | 75 | 3 | 27 | 9 | 81 |
| 150 | -6 | 342 |
Here,

Now, let's find the coefficient of variable for Group G2
| CI | f | x | u = (x – A)/h | fu | u2 | fu2 |
| 10 – 20 | 10 | 15 | -3 | 30 | 9 | 90 |
| 20 – 30 | 20 | 25 | -2 | 40 | 4 | 80 |
| 30 – 40 | 30 | 35 | -1 | 30 | 1 | 30 |
| 40 – 50 | 25 | 45 | 0 | 0 | 0 | 0 |
| 50 – 60 | 43 | 55 | 1 | 43 | 1 | 43 |
| 60 – 70 | 15 | 65 | 2 | 30 | 4 | 60 |
| 70 – 80 | 7 | 75 | 3 | 21 | 9 | 63 |
| 150 | -6 | 366 |
Here,
.png "Statistics – Exercise – 32.7 – Q.8(i)")
∴ Group G2 is more variable.
Statistics – Exercise – 32.7 – Q.9
| CI | f | x | u = (x - A)/h | fu | u2 | fu2 |
| 10 – 15 | 2 | 12.5 | -2 | -4 | 4 | 8 |
| 15 – 20 | 8 | 17.5 | -1 | -8 | 1 | 8 |
| 20 – 25 | 20 | 22.5 | 0 | 0 | 0 | 0 |
| 25 – 30 | 35 | 27.5 | 1 | 35 | 1 | 35 |
| 30 – 35 | 20 | 32.5 | 2 | 40 | 4 | 80 |
| 35 – 40 | 15 | 37.5 | 3 | 45 | 9 | 135 |
| 100 | 108 | 266 |
Here,

Statistics – Exercise – 32.7 – Q.10
| x | d = (x – Mean) | d2 |
| 35 | -13 | 169 |
| 24 | -24 | 576 |
| 52 | 4 | 16 |
| 53 | 5 | 25 |
| 56 | 8 | 64 |
| 58 | 10 | 100 |
| 52 | 4 | 16 |
| 50 | 2 | 4 |
| 51 | 3 | 9 |
| 49 | 1 | 1 |
| 480 | 980 |

| x | d = (x – Mean) | d2 |
| 35 | -13 | 169 |
| 24 | -24 | 576 |
| 52 | 4 | 16 |
| 53 | 5 | 25 |
| 56 | 8 | 64 |
| 58 | 10 | 100 |
| 52 | 4 | 16 |
| 50 | 2 | 4 |
| 51 | 3 | 9 |
| 49 | 1 | 1 |
| 480 | 980 |
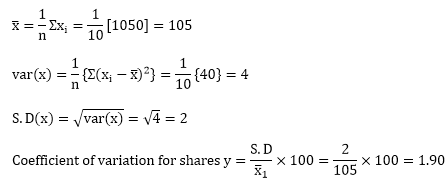
Since the coefficient of variation for shares Y is smaller than the coefficient of variation for shares X, they are more stable.
View courses by askIITians


Design classes One-on-One in your own way with Top IITians/Medical Professionals
Click Here Know More

Complete Self Study Package designed by Industry Leading Experts
Click Here Know More

Live 1-1 coding classes to unleash the Creator in your Child
Click Here Know More
