Chapter 27 Introduction to Graphs Exercise 27.2
Question: 1
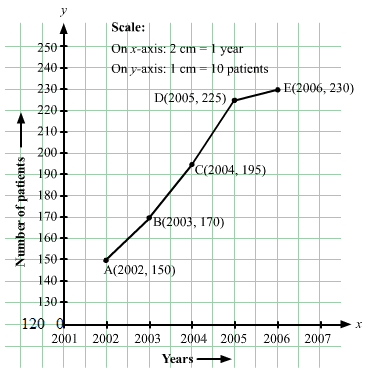
The following table shows the number of patients discharged from a hospital with HIV diagnosis in different years:
| Years: | 2002 | 2003 | 2004 | 2005 | 2006 |
| Number of Patients: | 150 | 170 | 195 | 225 | 230 |
Represent this information by a graph.
Solution:
Here, year is an independent variable and the number of patients is a dependent variable. So, we take years on the x-axis and the number of patients on the y-axis.
Let us choose the following scale:
On x-axis: 2 cm = 1 year
On y-axis: 1 cm = 10 patients
Also, let us assume that on the x-axis, origin (O) represents 2001 and on the y-axis, origin (O) represents 120, i.e. O (2001, 120).
Now, let us plot (2002, 150), (2003, 170), (2004, 195), (2005, 225), (2006, 230). These points are joined to get the graph representing the given information as shown in the figure below.
Question: 2
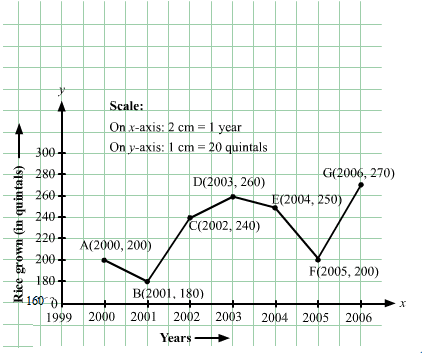
The following table shows the amount of rice grown by a farmer in different years:
| Years: | 2000 | 2001 | 2002 | 2003 | 2004 | 2005 | 2006 |
| Rice grown (in quintals): | 200 | 180 | 240 | 260 | 250 | 200 | 270 |
Plot a graph to illustrate this information.
Solution:
Here, the year is an independent variable and quantity of rice grown is a dependent variable. So, we take years on the x-axis and quantity of rice grown on the y-axis.
Let us choose the following scale:
On x-axis: 2 cm = 1 year
On y-axis: 1 cm = 20 quintals
Let us assume that the origin O represents the coordinates (1999, 160).
Now, let us plot (2000, 200), (2001, 180), (2002, 240), (2003, 260), (2004, 250),(2005, 200),(2006, 270).
These points are joined to get the graph representing the given information as shown in the figure below.
Question: 3
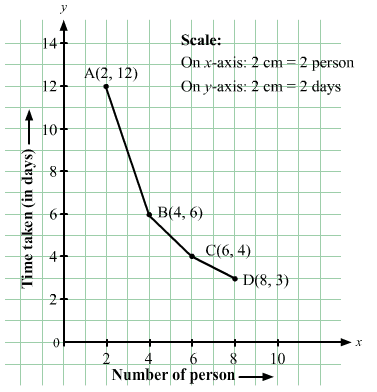
The following table gives the information regarding the number of persons employed to a piece of work and time taken to complete the work:
| Number of persons: | 2 | 4 | 6 | 8 |
| Time taken (in days): | 12 | 6 | 4 | 3 |
Plot a graph of this information.
Solution:
Here, the number of persons is an independent variable and time taken is a dependent variable. So, we take the number of persons on the x-axis and time taken on the y-axis.
Let us choose the following scale:
On x-axis: 2 cm = 2 persons
On y-axis: 2 cm = 2 days
Now, let us plot (2, 12), (4, 6), (6, 4), (8, 3). These points are joined to get the graph representing the given information as shown in the figure below.
Question: 4
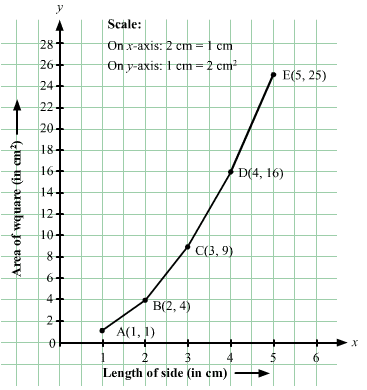
The following table gives the information regarding the length of a side of a square and its area:
| Length of a side (in cm): | 1 | 2 | 3 | 4 | 5 |
| Area of square (in cm2) | 1 | 4 | 9 | 16 | 25 |
Draw a graph to illustrate this information.
Solution:
Here, length of a side is an independent variable and area of the square is a dependent variable. So, we take the length of a side on the x-axis and area of the square on the y-axis.
Let us choose the following scale:
On x-axis: 2 cm = 1 cm
On y-axis: 1 cm = 2 cm2
Now we plot (1,1), (2,4), (3,9), (4,16), (5,25). These points are joined to get the graph representing the given information as shown in the figure below.
Question: 5
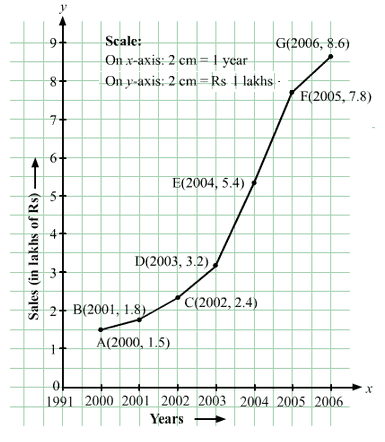
The following table shows the sales of a commodity during its years 2000 to 2006.
| Years: | 2000 | 2001 | 2002 | 2003 | 2004 | 2005 | 2006 |
| Sales (in lakhs of Rs): | 1.5 | 1.8 | 2.4 | 3.2 | 5.4 | 7.8 | 8.6 |
Draw a graph of this information.
Solution:
Here, year is an independent variable and sales is a dependent variable. So, we take year on the x-axis and sales on the y-axis.
Let us choose the following scale:
On x-axis: 2 cm = 1 year
On y-axis: 2 cm = 1 lakh rupees
Assume that on x-axis, origin (O) represents 1991.
So, the coordinates of O are (1991,0).
Now, let us plot (2000, 1.5), (2001, 1.8), (2002, 2.4), (2003, 3.2), (2004, 5.4), (2005, 7.8) and (2006, 8.6). These points are joined to get the graph representing the given information as shown in the figure below.
Question: 6
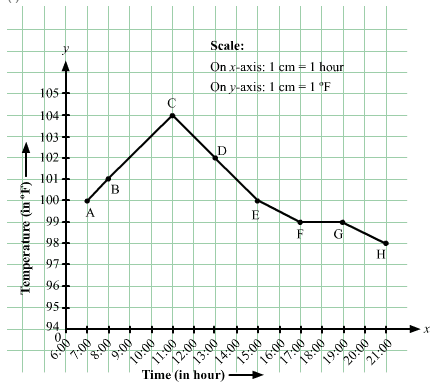
Draw the temperature-time graph in each of the following cases:
(i)
| Time (in hours): | 7:00 | 9:00 | 11:00 | 13:00 | 15:00 | 17:00 | 19:00 | 21:00 |
| Temperature (°F) in: | 100 | 101 | 104 | 102 | 100 | 99 | 100 | 98 |
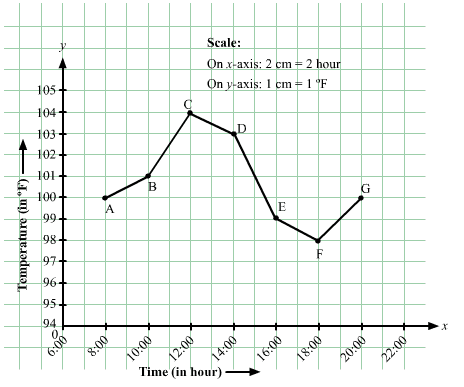
(ii)
| Time (in hours): | 8:00 | 10:00 | 12:00 | 14:00 | 16:00 | 18:00 | 20:00 |
| Temperature (°F) in: | 100 | 101 | 104 | 103 | 99 | 98 | 100 |
Solution:
Here, time is an independent variable and temperature is a dependent variable. So, we take time on the x-axis and temperature on the y-axis.
Let us choose the following scale:
For point (i):
On x-axis: 1 cm = 1 hours
On y-axis: 1 cm = 2°F
For point (ii):
On x-axis: 2 cm = 2 hours
On y-axis: 1 cm = 1°F
Let us assume that on the x-axis, the coordinate of origin is 6:00.
On y-axis, the coordinate of origin is 94°F .
So, the coordinates of 0 are (6:00, 94).
Now, let us plot (7:00, 100), (9:00, 101), (11:00, 104),..(21:00, 98) for point (i) and (8:00, 100), (10:00, 101), (12:00, 104) ….. (20:00, 100) for point (ii). These points are joined to get the graphs representing the given information as shown in the figures below.
(i)
(ii)
Question: 7
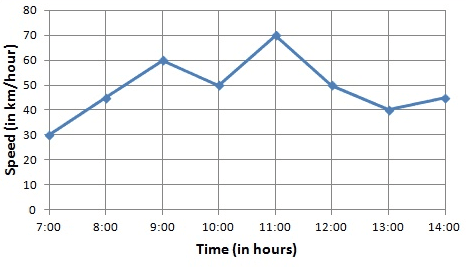
Draw the velocity-time graph from the following data:
| Time (in hours): | 7:00 | 8:00 | 9:00 | 10:00 | 11:00 | 12:00 | 13:00 | 14:00 |
| Speed (in km/hr): | 30 | 45 | 60 | 50 | 70 | 50 | 40 | 45 |
Solution:
Here, time is an independent variable and speed is a dependent variable. So, we take time on the x-axis and speed on the y-axis.
Let us choose the following scale:
On x-axis: 2 big division = 1 hour
On y-axis: 1 big division = 10 km/hr
Let us assume that on the x-axis, the coordinate of origin (O) is 7:00.
So, the coordinates of O are (7:00,0).
Now, let us plot (7:00,30), (8:00,45), (9:00,60), (10:00,50), (11:00,70), (12:00,50), (13:00,40), (14:00,45). These points are joined to get the graph representing the given information as shown in the figure below.
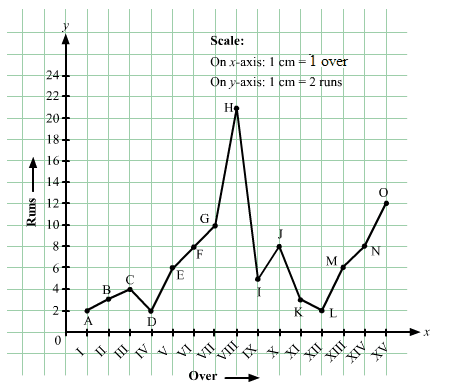
Question: 8
The runs scored by a cricket team in first 15 overs are given below:
| Overs: | I | II | III | IV | V | VI | VII | VIII | IX | X | XI | XII | XIII | XIV | XV |
| Runs: | 2 | 1 | 4 | 2 | 6 | 8 | 10 | 21 | 5 | 8 | 3 | 2 | 6 | 8 | 12 |
Draw the graph representing the above data in two different ways as a graph and a bar chart.
Solution:
Here, over is an independent variable and run is a dependent variable. So, we takeovers on the x-axis and runs the on y-axis.
Let us choose the following scale:
On x-axis: 1 cm = 1 over
On y-axis: 1 cm = 2 runs
Now, let us plot (I,2), (II,1), (III,4) (XV,12). These points are joined to get the graph representing the given information as shown in the figure below.
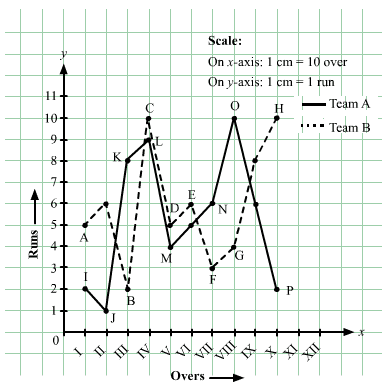
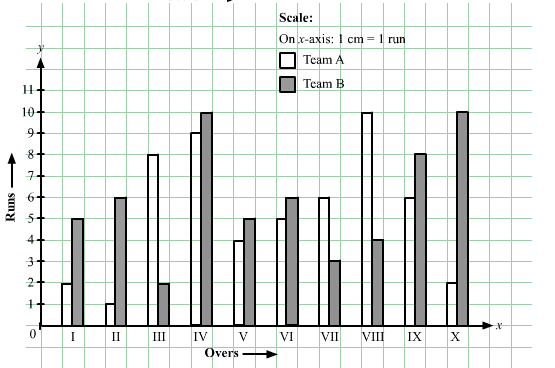
Question: 9
The runs scored by two teams A and B in first 10 overs are given below:
| Overs: | I | II | III | IV | V | VI | VII | VIII | IX | X |
| Team A: | 2 | 1 | 8 | 9 | 4 | 5 | 6 | 10 | 6 | 2 |
| Team B: | 5 | 6 | 2 | 10 | 5 | 6 | 3 | 4 | 8 | 10 |
Draw a graph depicting the data, making the graphs on the same axes in each case in two different ways as a graph and as a bar chart.
Solution:
Here, over is an independent variable and run is a dependent variable. So, we takeovers on x-axis and runs on y-axis.
Let us choose the following scale:
On x-axis: 1 cm = 1 over
On y-axis: 1 cm = 1 run
Now, let us plot (I,2), (II,1), (III,8) (X,2) for team A and (I,5), (II,6), (III,8) ….. (X,10) for team B. These points are joined to get the graph representing the given information as shown in the figure below.
View courses by askIITians


Design classes One-on-One in your own way with Top IITians/Medical Professionals
Click Here Know More

Complete Self Study Package designed by Industry Leading Experts
Click Here Know More

Live 1-1 coding classes to unleash the Creator in your Child
Click Here Know More
