Chapter 22 Data Handling II (Pictographs) Exercise 22.1
Question: 1
The sale of electric bulbs on different days of a week is shown below:
Observe the pictograph and answer the following questions:
(i) How many bulbs were sold Friday?
(ii) On which day maximum numbers of bulbs were sold?
(iii) If one bulb were sold at the rate of Rs 10, what was the total earning on Sunday?
(iv) Can you find out the total earning of the week?
(v) If one big carton can hold 9 bulbs. How many cartons were needed in the given week, more than 7, more than 8 or more than 9?

Solution:
(i) Number of figures of bulbs shown against Friday = 7
Given: 1 figure = 2 bulbs
Therefore, Total number of bulbs sold on Friday = 2 x 7 = 14
(ii) Sunday shows the maximum number of figure of bulbs, i.e. 9
Therefore, On Sunday, maximum bulbs were sold.
(iii) Number of figures of bulbs shown against Sunday = 9
Therefore, Total number of bulbs sold on Sunday = 2 x 9 = 18
Given, the cost of each bulb = Rs 10
Therefore, Total earning on Sunday = Rs 10 x 18 = Rs 180
(iv) Total number of figures of bulbs shown throughout the week
= 6 + 8 + 4 + 5 + 7 + 4 + 9 = 43
Therefore, Total number of bulbs = 43 x 2 = 86
Therefore, Total earning of the week = Rs 10 x 86 = Rs 860.
(v) Total number of bulbs = 86
Given that one big carton can hold 9 bulbs.
Therefore, for holding 86 bulbs, we need
869 = 959 cartons
So, more than 9 cartons are needed.
Question: 2
A survey was carried out in a certain school to find about different modes of transport used by students to travel to school each day. 30 students of class VI were interviewed and the data obtained was displayed in the form of pictographs given below:
Mode of transport Number of students

Look at the above pictograph and answer the following questions:
(i) Look at the above pictograph and answer the following questions
(ii) How many students are using cycle or walking as a mode of travel?
(iii) Which is the most popular mode of travel?
Solution:
(i) Number of students shown traveling to school using cycle = 3
Number of students shown walking to school = 8
Therefore, Number of students using cycle or walking as a mode of travelling to school = 3 + 8 =11
(ii) The pictograph shows that the maximum number of students, i.e. 10 are using the school bus as a mode of traveling to school.
Therefore, the most popular mode of travel to school is the school bus.
Question: 3
The number of girl students in each class of co-ed. Middle school is depicted by the following pictograph:
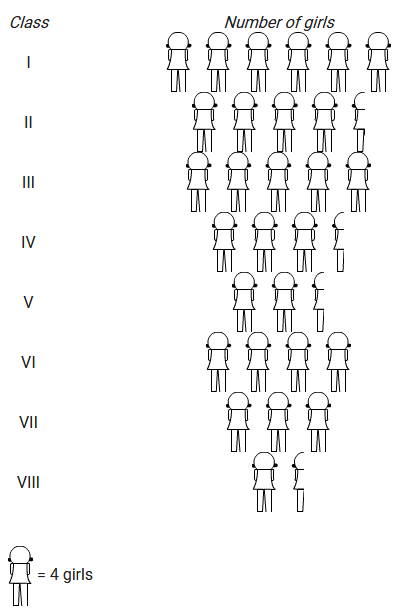
Observe the above pictograph and answer the following questions:
(i) Which class has the maximum number of girl students?
(ii) is the number of girls in class VI is less than the number of girls in class V?
(iii) How many girls are there in VII class?
Solution:
Based on the above pictograph, we can prepare the following chart to determine the number of girl students in each class.
Given, 1 figure = 4 girls
| Class | Numbers of girls |
| I | 6 x 4 = 24 |
| II | 4.5 x 4 = 18 |
| III | 5 x 4 = 20 |
| IV | 3.5 x 4 = 14 |
| V | 2.5 x 4 = 10 |
| VI | 4 x 4 = 16 |
| VII | 3 x 4 = 12 |
| VIII | 1.5 x 4 = 6 |
(i) From the chart we can easily say that the maximum number of girls i.e 24 are present in Class I
Therefore, Class I has the maximum number of girls.
(ii) Number of girls in class VI = 16
Number of girls in class V = 10
Therefore, number of girls in class VI is not less than the number of girls in class V
Ans: No
(iii) From the chart, we can say that these are 12 girls in class VII
Question: 4
In a village six fruit merchants sold the following number of fruit baskets in particular season:

Observe the above pictograph and answer the following questions.
(i) Which merchant sold the maximum number of baskets?
(ii) How many fruit baskets were sold by Anwar?
(iii) The merchants who have sold 600 or more number of baskets are planning to buy a godown for the next season. Can you name them?
Solution:
Given, one figure = 100 fruit baskets
Based on the above pictographs and hints, we can prepare the following charts to ascertain the maximum number of fruit baskets sold by each merchant:
| Merchant | Numbers of fruit baskets |
| Rahim | 4 x 100 = 400 |
| Lakhan pal | 5.5 x 100 = 550 |
| Anwar | 7 x 100 = 700 |
| Martin | 9.5 x 100 = 950 |
| Ranjit singh | 8 x 100 = 800 |
| Joseph | 4.5 x 100 = 450 |
(i) On the above chart we can see that martin sold the maximum number of baskets i.e. 950 fruits baskets.
Ans: Martin
(ii) Anwar sold 700 fruit baskets
(iii) On the above chart we can see that Anwar sold 700 fruit baskets, Martin sold 950 fruit baskets and Ranjit Singh sold 800 fruit baskets. Therefore, Anwar, Martin and Ranjit Singh are the merchants who are planning to buy a godown for the next season.
Question: 5
The pictograph shows different subject books which are kept in a library.

(i) How many English books are there in the library?
(ii) How many maths books are there?
(iii) Which books are maximum in number?
(iv) Which books are minimum in number?
Given, 1 figure = 100 books
Solution:
Based on the above pictograph and the given data, we can prepare the following chart to ascertain the number of books present in the library for each subject:
| Subjects | Numbers of books |
| Hindi | 5.5 × 100 = 550 |
| English | 8 × 100 = 800 |
| History | 2 × 100 = 200 |
| Science | 4 × 100 = 400 |
| Math | 2.5 × 100 = 250 |
(i) From the above charts, we can say that there are 800 English books in the library.
(ii) The calculation on the above chart shows that there are 250 Math books in the library.
(iii) From the above charts, we can say that the English books are maximum in number, as there are 800 books on that subject.
Therefore, English
(iv) From the above chart, we can see that the History books are minimum in number, as there are only 200 books of that subjects
Therefore, History
View courses by askIITians


Design classes One-on-One in your own way with Top IITians/Medical Professionals
Click Here Know More

Complete Self Study Package designed by Industry Leading Experts
Click Here Know More

Live 1-1 coding classes to unleash the Creator in your Child
Click Here Know More
