Graphical Representation of a Function
 The function f : R - {0} → R is represented in the graph such that the x co-ordinate represents the independent variable and the y co-ordinate represents the dependent variable. The graph of the function shows various properties of the function directly and more clearly. The limiting case of the graph of the function is represented by an asymptote:
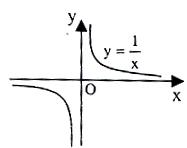
Asymptote is a straight line to which graph of the function approaches at infinity but does not exactly touch it as shown in figure shown above.
Coordinate axis x = 0 is asymptotes to the graph of y = 1/x.
We consider some examples of functions and their graphs
|
S.No. |
Function |
Domain, Range and Definition |
Graph |
|
1. |
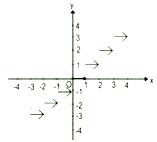
A Constant Function |
f : R → {c} defined by f{x} = c |
|
|
2. |
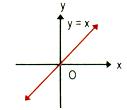
The Identity Function |
f : R → R defined by f(x) = x |
|
|
3. |
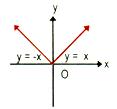
The Absolute Value Function |
f : R → [0, ∞) defined by f(x) = |x| |
|
|
4. |
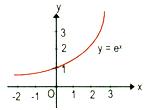
The Exponential Function |
f : R → (0, ∞) defined by f(x) = ex |
|
|
5. |
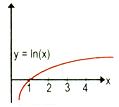
The Natural Logarithmic |
f: (0, ∞) → R defined by f(x) = In x |
|
|
6. |
The Greatest Integer Function |
f : R → Z defined by f(x) = [x] the greatest integer < x |
|
|
7. |
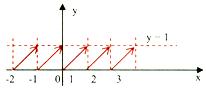
The Fractional part of x |
f : R → R defined by f(x) = {x} |
|
|
8. |
Polynomial Functions |
f(x) = a0xn + a1xn-1 + .... + an-1 x + an where a0, a1, ......, an are real numbers, a0 ≠ 0. |
|
|
9. |
Rational Functions |
f(x) = p(x)/q(x), where p(x) and q(x) are polynomials in x. Domain is R - {x : q(x) = 0} |
|

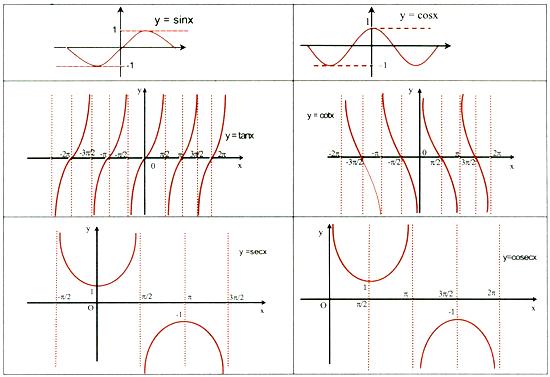
10. Trigonometric or Circular Functions:
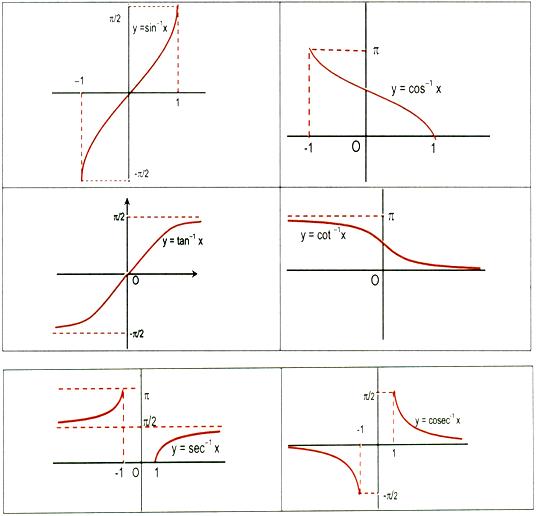
11. Inverse circular Functions
Register for online classroom programmes targeting IIT JEE 2010 and 2011. You can also participate in the online tests conducted by askIITians and also give answers in AQAD ( A Question A Day) to get a number of benefits in the online live classroom courses. Visit askIITians.com to read online Study material for IIT JEE and AIEEE preparation absolutely free.
To read more, Buy study materials of Set Relations and Functions comprising study notes, revision notes, video lectures, previous year solved questions etc. Also browse for more study materials on Mathematics here.
View courses by askIITians


Design classes One-on-One in your own way with Top IITians/Medical Professionals
Click Here Know More

Complete Self Study Package designed by Industry Leading Experts
Click Here Know More

Live 1-1 coding classes to unleash the Creator in your Child
Click Here Know More
