Electrostatics
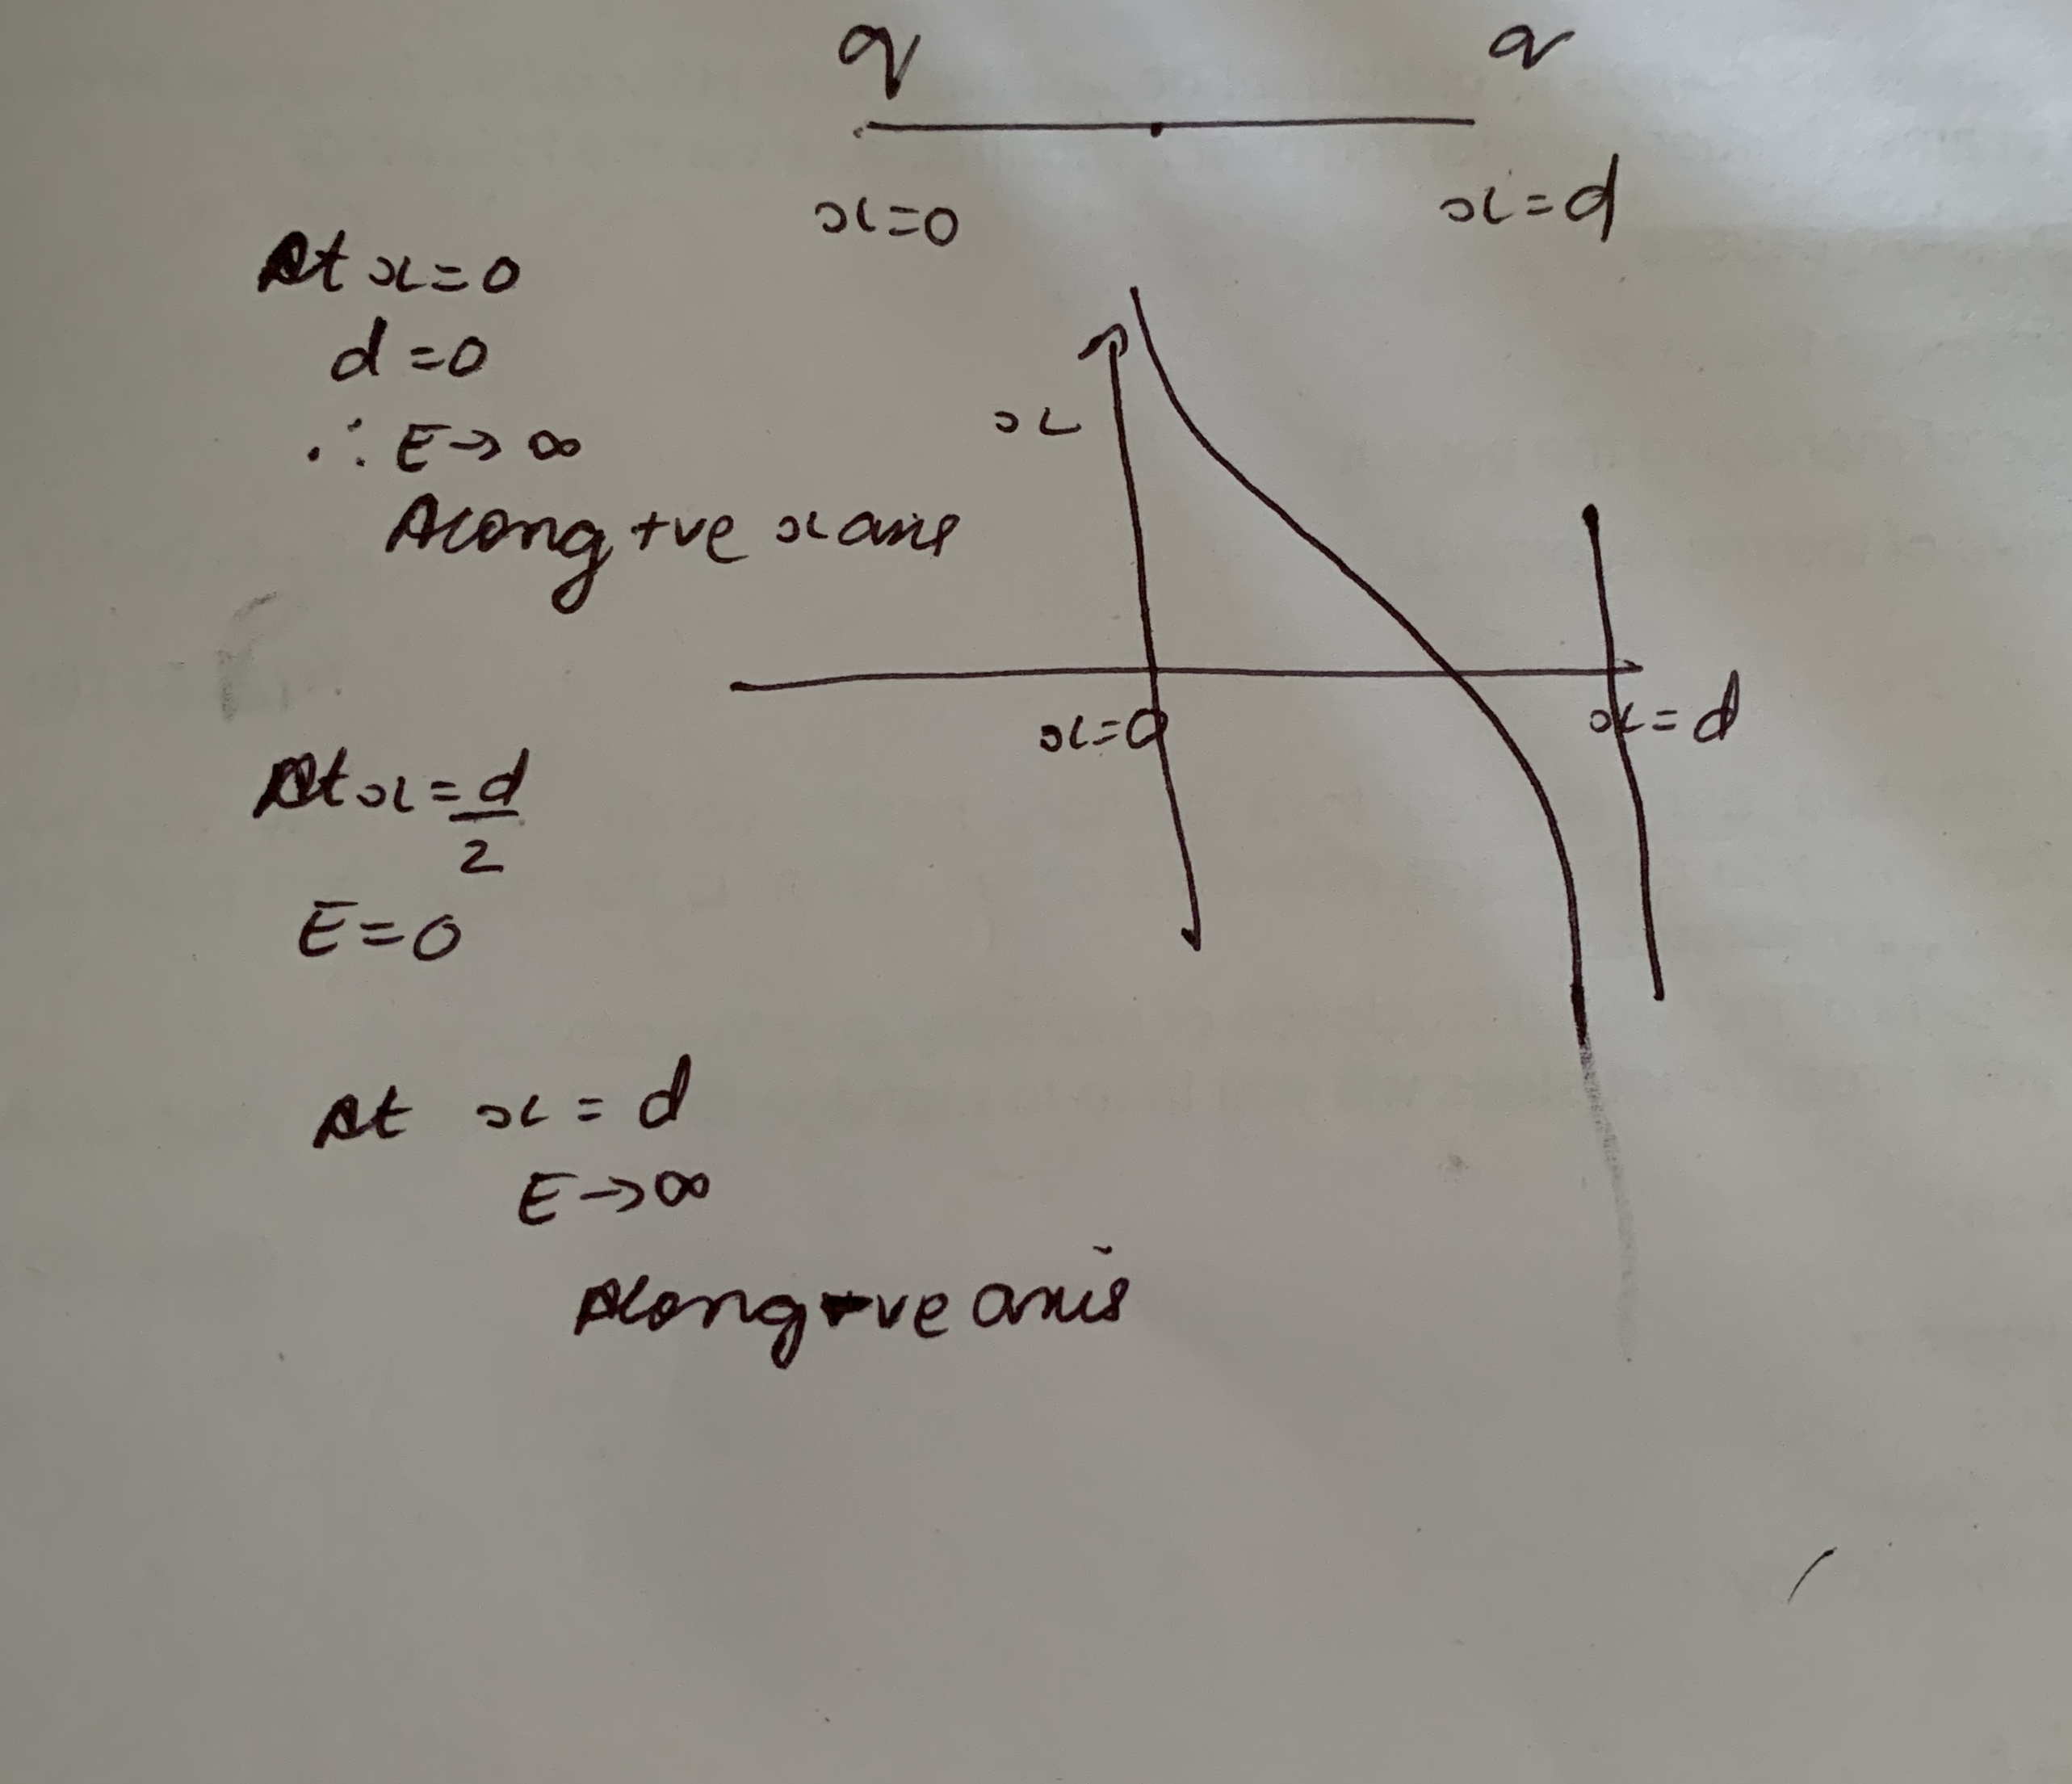
Two positive charges each of magnitude q are placed at x=0 and x=d. Sketch a graph that represent the variation of electric field intensity with x- coordinate.please explain
Two positive charges each of magnitude q are placed at x=0 and x=d. Sketch a graph that represent the variation of electric field intensity with x- coordinate.please explain