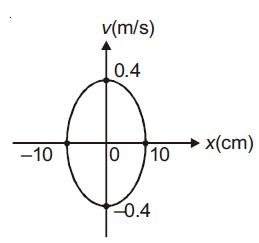
To determine the time period of oscillation for a particle executing simple harmonic motion (SHM) from a velocity versus displacement plot, we can analyze the characteristics of the graph. In SHM, the relationship between velocity and displacement is sinusoidal, and the maximum velocity occurs when the displacement is zero. Let's break down the steps to find the time period.
Understanding the Velocity-Displacement Relationship
In simple harmonic motion, the velocity \( v \) of a particle can be expressed as:
- \( v = A \omega \cos(\omega t + \phi) \)
Here, \( A \) is the amplitude, \( \omega \) is the angular frequency, \( t \) is time, and \( \phi \) is the phase constant. The displacement \( x \) can be represented as:
- \( x = A \sin(\omega t + \phi) \)
From these equations, we can see that the velocity is maximum when the displacement is zero, and it decreases to zero as the particle reaches the maximum displacement (amplitude).
Analyzing the Graph
In the velocity versus displacement graph for SHM, you will typically see a cosine-like curve. The key points to note are:
- The maximum velocity corresponds to the zero displacement.
- The velocity changes direction at the maximum and minimum displacements.
The time period \( T \) of the oscillation is related to the angular frequency \( \omega \) by the formula:
- \( T = \frac{2\pi}{\omega} \)
Finding Angular Frequency
To find \( \omega \), we can look at the slope of the velocity versus displacement graph. The slope at any point gives us the relationship between the velocity and displacement. The maximum slope corresponds to the maximum velocity, which can be used to find \( \omega \).
If the graph shows the maximum velocity \( v_{\text{max}} \) and the amplitude \( A \), we can use the relationship:
- \( v_{\text{max}} = A \omega \)
From this, we can rearrange to find \( \omega \):
- \( \omega = \frac{v_{\text{max}}}{A} \)
Calculating the Time Period
Once you have \( \omega \), substitute it back into the formula for the time period:
- \( T = \frac{2\pi}{\frac{v_{\text{max}}}{A}} = \frac{2\pi A}{v_{\text{max}}} \)
This equation allows you to calculate the time period of the oscillation based on the maximum velocity and the amplitude observed in the graph.
Example
Suppose the maximum velocity \( v_{\text{max}} \) is 10 m/s and the amplitude \( A \) is 5 m. Plugging these values into the equation gives:
- \( \omega = \frac{10}{5} = 2 \, \text{rad/s} \)
- \( T = \frac{2\pi}{2} = \pi \, \text{s} \) (approximately 3.14 seconds)
By following these steps, you can effectively determine the time period of oscillation for a particle in simple harmonic motion using the velocity versus displacement graph. This method not only reinforces your understanding of SHM but also enhances your analytical skills in interpreting graphical data.