Statistics CBSE Class 10 Maths Revision Notes Chapter 14
Statistics
Statistics is one of the parts of mathematics in which we study about the collecting, organizing, analyzing, interpreting and presenting data.
Statistics is very helpful in real life situations as it is easy to understand if we represent a data in a particular number which represents all numbers. This number is called the measure of central tendency. Some of the central tendencies commonly in use are -
Mean
It is the average of “n” numbers, which is calculated by dividing the sum of all the numbers by n.
The mean of n values x1, x2, x3, ...... xn is given by

Median
If we arrange the numbers in an ascending or descending order then the middle number of the series will be median. If the number of series is even then the median will be the average of two middle numbers.
If n is odd then the median is observation.
If the n is even then the median is the average of observation.
Mode
The number which appears most frequently in the series then it is said to be the mode of n numbers.
Mean of Grouped Data (Without Class Interval)
If the data is organized in such a way that there is no class interval then we can calculate the mean by

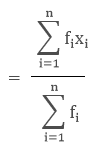
where, x1, x2, x3,...... xn are the observations
f1, f2, f3, ...... fn are the respective frequencies of the given observations.
Example
| Grouped Population Mean | ||
| x | f | fx |
| 20 | 40 | 800 |
| 40 | 60 | 2400 |
| 60 | 30 | 1800 |
| 80 | 50 | 4000 |
| 100 | 20 | 2000 |
| 200 | ∑fx = 11000 | |
Here, x1, x2, x3, x4, x5 are 20, 40, 60, 80, 100 respectively and f1, f2, f3 , f4, f5 are 40, 60, 30, 50, 20 respectively.

Mean of Grouped Data (With Class-Interval)
When the data is grouped in the form of class interval then the mean can be calculated by three methods.
1. Direct Method
In this method, we use a midpoint which represents the whole class. It is called the class mark. It is the average of the upper limit and the lower limit.


Example
A teacher marks the test result of the class of 55 students for mathematics. Find the mean for the given group.
| Marks of Students | 0 – 10 | 10 – 20 | 20 – 30 | 30 – 40 | 40 – 50 | 50 – 60 |
| Frequency | 27 | 10 | 7 | 5 | 4 | 2 |
To find the mean we need to find the mid-point or class mark for each class interval which will be the x and then by multiplying frequency and midpoint we get fx.
| Marks of students | Frequency(f) | Midpoint(x) | fx |
| 0 – 10 | 27 | 5 | 135 |
| 10 – 20 | 10 | 15 | 150 |
| 20 – 30 | 7 | 25 | 175 |
| 30 – 40 | 5 | 35 | 175 |
| 40 – 50 | 4 | 45 | 180 |
| 50 – 60 | 2 | 55 | 110 |
| ∑f = 55 | ∑fx = 925 |

2. Deviation or Assumed Mean Method
If we have to calculate the large numbers then we can use this method to make our calculations easy. In this method, we choose one of the x’s as assumed mean and let it as “a”. Then we find the deviation which is the difference of assumed mean and each of the x. The rest of the method is the same as the direct method.

Example
If we have the table of the expenditure of the company's workers in the household, then what will be the mean of their expenses?
| Expense(Rs.) | 100 - 150 | 150 - 200 | 200 - 250 | 250 - 300 | 300 - 350 | 350 - 400 |
| Frequency | 24 | 40 | 33 | 28 | 30 | 22 |
Solution
As we can see that there are big values of x to calculate so we will use the assumed mean method.
Here we take 275 as the assumed mean.
| Expenses(Rs.) | Frequency(f) | Mid value(x) | d = x – 275 | fd |
| 100 – 150 | 24 | 125 | - 150 | - 3600 |
| 150 – 200 | 40 | 175 | - 100 | - 4000 |
| 200 – 250 | 36 | 225 | - 50 | -1650 |
| 250 – 300 | 28 | 275 | 0 | 0 |
| 300 – 350 | 30 | 325 | 50 | 1500 |
| 350 – 400 | 22 | 375 | 100 | 2200 |
| ∑f = 180 | ∑fd = - 5550 |

3. Step Deviation Method
In this method, we divide the values of d with a number "h" to make our calculations easier.

Example
The wages of the workers are given in the table. Find the mean by step deviation method.
| Wages | 20 - 30 | 20 - 30 | 30 - 40 | 40 - 50 | 50 - 60 |
| No. of workers | 8 | 9 | 12 | 11 | 6 |
Solution
| Wages | No. of workers (f) | Mid-point(x) | Assume mean (a) = 35, d = x - a | h = 10, u = (x – a)/h | fu |
| 10 – 20 | 8 | 15 | -20 | -2 | -16 |
| 20 – 30 | 9 | 25 | -10 | -1 | -9 |
| 30 – 40 | 12 | 35 | 0 | 0 | 0 |
| 40 – 50 | 11 | 45 | 10 | 1 | 11 |
| 50 – 60 | 6 | 55 | 20 | 2 | 12 |
| ∑f = 46 | ∑fu = -2 |

Mode of Grouped Data
In the ungrouped data the most frequently occurring no. is the mode of the sequence, but in the grouped data we can find the class interval only which has the maximum frequency number i.e. the modal class.
The value of mode in that modal class is calculated by

l = lower class limit of the modal class
h = class interval size
f1 =frequency of the modal class
f0 =frequency of the preceding class
f2 = frequency of the succeeding class
Example
The table of the marks of the students of a class is given. Find the modal class and the mode.
| Marks | 0 – 20 | 20 – 40 | 40 – 60 | 60 – 80 | 80 – 100 |
| No. of students | 4 | 8 | 6 | 7 | 5 |
Solution
Here we can see that the class interval with the highest frequency 8 is 20 – 40.
So this is our modal class.
Modal class = 20 - 40
Lower limit of modal class (l) = 20
Class interval size (h) = 20
Frequency of the modal class(f1) = 8
Frequency of the preceding class(f0) = 4
Frequency of the succeeding class (f2) = 6

Median of Grouped Data
To find the median of a grouped data, we need to find the cumulative frequency and n/2
Then we have to find the median class, which is the class of the cumulative frequency near or greater than the value of n/2.
Cumulative Frequency is calculated by adding the frequencies of all the classes preceding the given class.
Then substitute the values in the formula

where l = lower limit of median class
n = no. of observations
cf = cumulative frequency of the class preceding to the median class
f = frequency of the median class
h = size of class
Example
Find the median of the given table.
| Class Interval | Frequency | Cumulative Frequency (fc) | |
| 1 – 5 | 4 | 4 | 4 |
| 6 – 10 | 3 | 7 | 4 + 3 = 7 |
| 11 – 15 | 6 | 13 | 7 + 6 = 13 |
| 16 – 20 | 5 | 18 | 13 + 5 = 18 |
| 21 – 25 | 2 | 20 | 18 + 2 = 20 |
| N = 20 |
Solution
Let’s find the n/2.
n = 20, so n/2 = 20/2 = 10
The median class is 11 - 15 as its cumulative frequency is 13 which is greater than 10.

13.5
Remark: The empirical relation between the three measures of central tendency is
3 Median = Mode + 2 Mean
Graphical Representation of Cumulative Frequency Distribution
The graph makes the data easy to understand. So to make the graph of the cumulative frequency distribution, we need to find the cumulative frequency of the given table. Then we can plot the points on the graph.
The cumulative frequency distribution can be of two types -
1. Less than ogive
To draw the graph of less than ogive we take the lower limits of the class interval and mark the respective less than frequency. Then join the dots by a smooth curve.
2. More than ogive
To draw the graph of more than ogive we take the upper limits of the class interval on the x-axis and mark the respective more than frequency. Then join the dots.
Example
Draw the cumulative frequency distribution curve for the following table.
| Marks of students | 0 – 10 | 10 – 20 | 20 – 30 | 30 – 40 | 40 – 50 | 50 – 60 |
| No. of students | 7 | 10 | 14 | 20 | 6 | 3 |
Solution
To draw the less than and more than ogive, we need to find the less than cumulative frequency and more than cumulative frequency.
| Marks | No. of students | Less than cumulative frequency | More than cumulative frequency | ||
| 0 – 10 | 7 | Less than 10 | 7 | More than 0 | 60 |
| 10 – 20 | 10 | Less than 20 | 17 | More than 10 | 53 |
| 20 – 30 | 14 | Less than 30 | 31 | More than 20 | 43 |
| 30 – 40 | 20 | Less than 40 | 51 | More than 30 | 29 |
| 40 – 50 | 6 | Less than 50 | 57 | More than 40 | 9 |
| 50 – 60 | 3 | Less than 60 | 60 | More than 50 | 3 |
| More than 60 | 0 | ||||
Now we plot all the points on the graph and we get two curves.

Remark
-
The class interval should be continuous to make the ogive curve.
-
The x-coordinate at the intersection of the less than and more than ogive is the median of the given data.
View courses by askIITians


Design classes One-on-One in your own way with Top IITians/Medical Professionals
Click Here Know More

Complete Self Study Package designed by Industry Leading Experts
Click Here Know More

Live 1-1 coding classes to unleash the Creator in your Child
Click Here Know More
