Chapter 25: Probability Exercise – 25.1
Question: 1
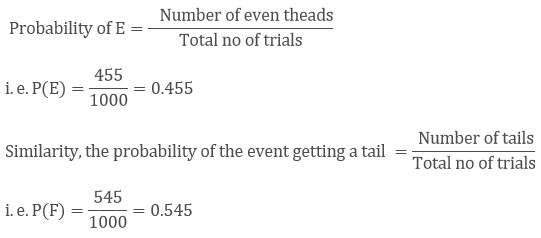
A coin is tossed 1000 times with the following sequence: Head: 455, Tail = 545. Compute the probability of each event
Solution:
It is given that the coin is tossed 1000 times. The number of trials is 1000
Let us denote the event of getting head and of getting tails be E and F respectively. Then
Number of trials in which the E happens = 455
So,
Question: 2
Two coins are tossed simultaneously 500 times with the following frequencies of different outcomes:
TWO HEADS: 95 times
ONE HEADS: 290 times
NO HEADS: 115 times
Find the probability of occurrence of each of these events
Solution:

P(Getting two heads) = 95/500 = 0.19
P(Getting one tail) = 290/500 = 0.58
P(Getting no head) = 115/500 = 0.23
Question: 3
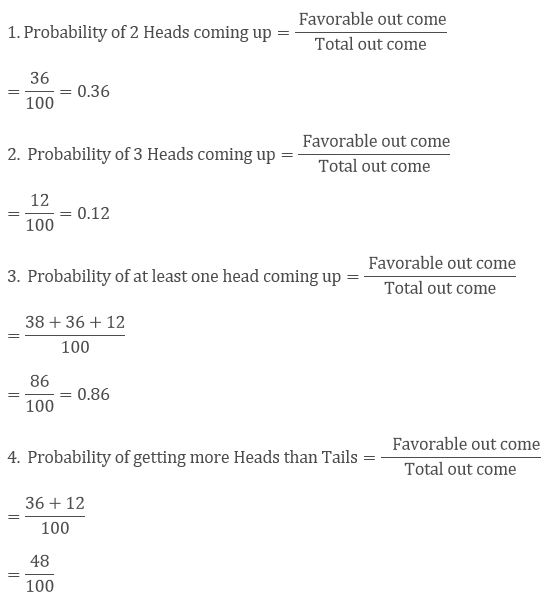
Three coins are tossed simultaneously 100 times with the following frequencies of different outcomes:
| Outcome | No head | One Head | Two Head | Three Head |
| Frequency | 14 | 38 | 36 | 12 |
If the three coins are tossed simultaneously again, compute the probability of:
1. heads coming up
2. heads coming up
3. At least one Head coming up
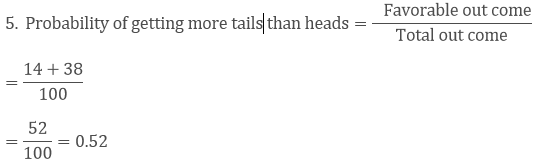
4. Getting more Tails than Heads
5. Getting more heads than tails
Solution:
Question: 4
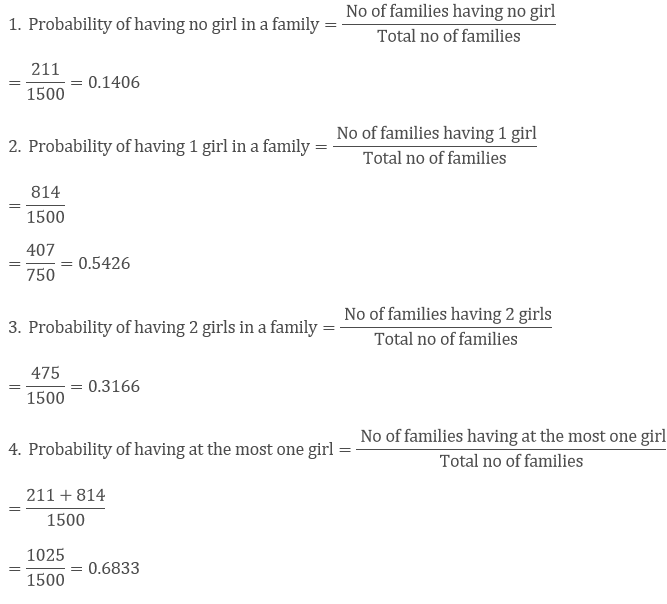
1500 families with 2 children were selected randomly, and the following data were recorded:
| No of girls in a family | 0 | 1 | 2 |
| No of girls | 211 | 814 | 475 |
If a family is chosen at random, compute the probability that it has:
1. No girl
2. 1 girl
3. 2 girls
4. At most one girl
5. More girls than boys
Solution:
Question: 5
In a cricket match, a batsman hits a boundary 6 times out of 30 balls he plays. Find the probability that:
1. He hit a boundary
2. He did not hit a boundary.
Solution:
Number of times the batsman hits a boundary = 6
Total number of balls played = 30
Number of times the batsman did not hit a boundary = 30 - 6 = 24
1. Probability that the batsman hits a boundary
= 6/30
= 15
2. Probability that the batsman does not hit a boundary
= 24/30
= 4/5
Question: 6
The percentage of marks obtained by a student in the monthly unit tests are given below:
| Unit Test | I | II | III | IV | V |
| Percentage of Mark Obtained | 69 | 71 | 73 | 68 | 76 |
Find the probability that the student gets
1. More than 70% marks
2. Less than 70% marks
3. A distinction
Solution:
1: Let E be the event of getting more than 70% marks
No of times E happens = 3

= 3/5 = 0.6
2. Let F be the event of getting less than 70% marks
No of times F happen = 2

= 2/5 = 0.4
3. Let G be the event of getting distinction
No of times G happen = 1

=1/5 = 0.2
Question: 7
To know the opinion of the students about Mathematics, a survey of 200 students were conducted. The data was recorded in the following table
| Opinion | Like | Dislike |
| Number of students | 135 | 65 |
Find the probability that student chosen at random:
1. Likes Mathematics
2. Does not like it.
Solution:
1. Probability that a student likes mathematics
= 135/200
= 0.675
2. Probability that a student does not like mathematics
= 65/200
= 0.325
Question: 8
The Blood group table of 30 students of class IX is recorded as follows:
A, B, O, O, AB, O, A, O, B, A, O, B, A, O, O
A, AB, O, A, A, O, O, AB, B, A, O, B, A, B, O
A student is selected at random from the class from blood donation. Find the probability that the blood group of the student chosen is:
1: A
2: B
3: AB
4: O
Solution:
| Blood Group | A | B | O | AB | Total |
| Number of Students | 9 | 6 | 12 | 3 | 30 |
1. Probability of a student having blood group A
= 9/30
= 0.3
2. Probability of a student having blood group B
= 6/30
= 0.2
3. Probability of a student having blood group AB
= 3/30
= 1/10 = 0.10
4. Probability of a student having blood group O
= 12/30 = 0.4
Question: 9
Eleven bags of wheat flour, each marked 5kg, actually contained the following weights of flour (in Kg)
| 4.97 | 5.05 | 5.08 | 5.03 | 5 | 5.06 | 5.08 | 4.98 | 5.04 | 5.07 | 5 |
Find the probability that any of these bags chosen at random contains more than 5 kg of flour.
Solution:
Number of bags weighing more than 5 kgs = 7
Total no of bags = 11
Probability of having more than 10 kgs of rice
= 7/11 = 0.63
Question: 10
The following table show the birth month of 40 students in class IX:
| Jan | Feb | Mar | Apr | May | June | July | Aug | Sep | Oct | Nov | Dec |
| 3 | 4 | 2 | 2 | 5 | 1 | 2 | 5 | 3 | 4 | 4 | 4 |
Find the probability that a student is born in October
Solution:
1. Probability that a student is born in the month of October
= 6/40
= 3/20
= 0.15
Question: 11
Given below is the frequency distribution table regarding the concentration of SO2 in the air in parts per million of a certain city for 30 days.
| Concentration of SO2 | 0.00 – 0.04 | 0.04 – 0.08 | 0.08 – 0.12 | 0.12 – 0.16 | 0.16 – 0.20 | 0.20 – 0.24 |
| No of days | 4 | 8 | 9 | 2 | 4 | 3 |
Find the probability of the concentration of SO2 in the interval 0.12-0.16 on any of these days.
Solution:
Total no of days: 30
Probability of concentration of SO2 in interval 0.12 - 0.16
= 2/30
= 1/15
= 0.06
Question: 12
A company selected 2400 families at random and surveys them to determine a relationship between income level and the number of vehicles in a home. The information gathered is listed below:
Vechicles Per Family:
| Monthly Income | 0 | 1 | 2 | Above 2 |
| Less than 7000 | 10 | 160 | 25 | 0 |
| 7000 – 10000 | 0 | 305 | 27 | 2 |
| 10000 – 13000 | 1 | 535 | 29 | 1 |
| 13000 – 16000 | 2 | 469 | 29 | 25 |
| 16000 above | 1 | 579 | 82 | 88 |
If a family is chosen at random find the probability that the family is:
1. Earning Rs 10000 – 13000 per month and owning exactly 2 vehicles.
2. Earning Rs 16000 or more per month and owning exactly 1 vehicle.
3. Earning less than Rs 7000 per month and does not own any vehicle.
4. Earning Rs 13000 – 16000 per month and owning more than 2 vehicles.
5. Owning not more than 1 vehicle.
6. Owning at least one vehicle
Solution:
1. The probability that the family is earning 10000-13000 and is having exactly 2 vehicles
= 29/2400
2. The probability that the family is earning 16000 or more and is having exactly 1 vehicle
= 579/2400
3. The probability that the family is earning less than 7000 and is having no vehicle
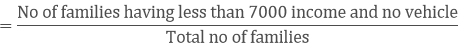
= 10/2400 = 1240
4. The probability that the family is earning 13000-16000 and is having more than 2 vehicles

= 25/2400 = 196
5. The probability that the family is having not more than one vehicle
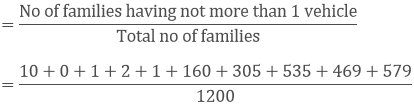
= 2062/2400
= 1031/1200
6. The probability that the family is having at least one vehicle
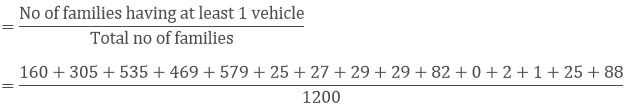
= 2356/2400
= 589/600
Question: 13
The following table gives the life time of 400 neon lamps:
| Life time | 300 - 400 | 400 – 500 | 500 – 600 | 600 – 700 | 700 – 800 | 800 – 900 | 900 – 1000 |
| bulbs | 14 | 56 | 60 | 86 | 74 | 62 | 48 |
A bulb is selected at random. Find the probability that the lifetime of a selected bulb:
1. Less than 400 hrs
2. between 300 - 800 hours
3. At least 700 hours
Solution:
Total number of bulbs = 400
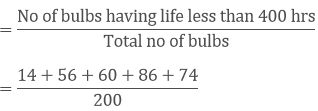
1. Probability that the life of the selected bulb is less than 400 hrs
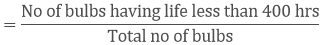
= 14/400
= 7/200
2. Probability that the life of the selected bulb is between 300 - 800 hrs
= 290/400
= 29/40
3. Probability that the life of the selected bulb is at least 700 hrs
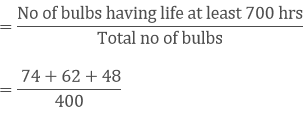
= 184/400
= 23/50
Question: 14
Given below is the frequency distribution of wages (in Rs) of 30 workers in certain factory:
| Wages | 110 – 130 | 130 – 150 | 150 – 170 | 170 – 190 | 190 – 210 | 210 – 230 | 230 – 250 |
| No of workers | 3 | 4 | 5 | 6 | 5 | 4 | 3 |
A worker is selected at random. Find the probability that his wages are:
1. Less than Rs.150
2. At least Rs.210
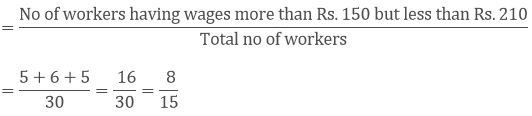
3. More than or equal to 150 but less than 210
Solution:
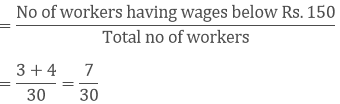
Total number of workers = 30
1. Probability that the worker wages are less than Rs.150
2. Probability that the worker wages are at least Rs.210
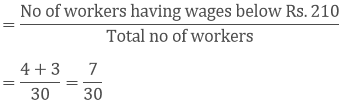
3. Probability that the worker wages are more than or equal to 150 but less than 210
View courses by askIITians


Design classes One-on-One in your own way with Top IITians/Medical Professionals
Click Here Know More

Complete Self Study Package designed by Industry Leading Experts
Click Here Know More

Live 1-1 coding classes to unleash the Creator in your Child
Click Here Know More
