Chapter 23: Graphical Representation of Statistical Data Exercise – 23.1
Question: 1
The following table shows the daily production of T.V. sets in an industry for 7 days of a week.
Represent the above information by a pictograph.
| Day | Monday | Tuesday | Wednesday | Thursday | Friday | Saturday | Sunday |
| Number of Tv sets | 300 | 400 | 150 | 250 | 100 | 350 | 200 |
Solution:
The given information can be represented using a pictograph in the following manner:

Question: 2
The following table shows the number of Maruti cars sold by five dealers in a particular month:
Represent the above information by a pictograph.
| Dealer | saya | Bagga links | D.D Motors | Bhasin Motors | Competent |
| Cars sold | 60 | 40 | 20 | 15 | 10 |
Solution:
The given information can be represented using a pictograph in the following manner:

Question: 3
The population of Delhi State in different census years is as given below:
| Census year | 1961 | 1971 | 1981 | 1991 | 2001 |
| Population in Lakhs | 30 | 55 | 70 | 110 | 150 |
Represent the above information with the help of a bar graph.
Solution:
While drawing a bar graph, we keep in mind that:
The width of the bars should be uniform throughout.
The gap between any two bars should be uniform throughout.
Bars may be either horizontal or vertical.
To represent the given data by a vertical bar graph, we first draw horizontal and vertical axes.
Let us consider that the horizontal and vertical axes represent the years and the population in lakhs respectively. We have to draw 5 bars of different heights given in the table. At first, we mark 5 points in the horizontal axis at equal distances and erect rectangles of the same width at these points. The heights of the rectangles are proportional to the population in lakhs. The vertical bar graph of the given data is following:

Note that each bar is of the same width and the gap between them is uniform. Make sure that the width of the bars and the gap between them should not be necessarily same.
Question: 4
 Read the bar graph shown in the figure and answer the following questions:
(i) What is the information given by the bar graph?
(ii) How many tickets of Assam State Lottery were sold by the agent?
(iii) Of which state, were the maximum number of tickets sold?
(iv) State whether true or false.
The maximum number of tickets sold is three times the minimum number of tickets sold.
(v) Of which state were the minimum numbers of tickets sold?
Solution:
(i) The bar graph represents the number of tickets of different state lotteries sold by an agent on a day.
(ii) The number of tickets of Assam State Lottery were sold by the agent is 40.
(iii) The maximum numbers of tickets were sold is 100, in the state Haryana
(iv) The maximum number of tickets were sold is 100, in the state Haryana the minimum number of tickets were sold is 20, in the state Rajasthan. It is clear that 100 are equal to the 5 times of 20. Hence, the statement is false.
(v) The minimum numbers of tickets were sold is 20, in the state Rajasthan.
Question: 5
Study the bar graph representing the number of persons in various age groups in a town shown in figure Observe the bar graph and answer the following questions:
(i) What is the percentage of the youngest age-group persons over those in the oldest age group?
(ii) What is the total population of the town?
(iii) What is the number of persons in the age-group 60 – 65?
(iv) How many persons are more in the age-group 10 – 15 than in the age group 30 – 35?
(v) What is the age-group of exactly 1200 persons living in the town?
(vi) What is the total number of persons living in the town in the age-group 50 – 55?
(vii) What is the total number of persons living in the town in the age-groups 10 – 15 and 60 – 65?
(vii) Whether the population in general increases, decreases or remains constant with the increase in the age-group.

Solution:
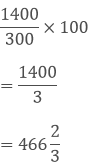
(i) The youngest age-group is 10-15 years. The number of persons belonging to this group is 1400. The oldest age-group is 70-75 years. The number of persons belonging to this group is 300. The percentage of youngest age-group persons over those in the oldest group is
(ii) The population of the town is 300 + 800 + 900 + 1000 + 1100 + 1200 + 1400 = 6700
(iii) The number of persons in the age group 60 – 65 is 800.
(iv) The number of persons in the age group 10 – 15 is 1400 and the number of persons in the age group 30 – 35 is 1100. Hence the number of more persons in the age group 10 – 15 than the group 30 – 35 is 1400 – 1100 = 300.
(v) The age group of 1200 persons living in the town is 20 – 25.
(vi) The total number of persons living in the town in the age-group 50 – 55 is 900.
(vii) The total number of persons living in the town in the age-groups 10 -15 and 60 – 65 is 1400 + 800 = 2200.
(viii) It is shown from the bar graph that the height of the bars decreases as the age-group increases. Hence, the population decreases with the increases in the age-group.
Question: 6
Read the bar graph shown in the figure and answer the following questions:

(i) What is the information given by the bar graph?
(ii) What was the number of commercial banks in 1977?
(iii) What is the ratio of the number of commercial banks in 1969 to that in 1980?
(iv) State whether true or false:
The number of commercial banks in 1983 is less than double the number of commercial banks in 1969.
Solution:
(i) The bar graph represents the number of commercial banks in India during some particular years.
(ii) The number of commercial banks in 1977 was
120 + (140 – 120)/2
⟹ 120 + 20/2
⟹ 120 + 10
⟹ 130
(iii) The number of commercial banks in 1969 was
80 + (100 – 80)/2
⟹ 80 + 20/2
⟹ 80 + 10
⟹ 90
The number of commercial banks in 1980 was
140 + (160 -140)/ 2
⟹ 140 +20/2
⟹ 140 + 10
= 150
Hence, the required ratio is 90/150
⟹ 3/5
⟹ 3:5
(iv) The number of commercial banks in 1983 was
220 + (240 – 220)/ 2
⟹ 220 + 20/2
⟹ 220 + 10
⟹ 230
The number of commercial banks in 1969 was 90.
When we multiply this number by 2, it becomes 2 × 90 = 180
Clearly, 230 is not less than 180. Hence the statement is false.
Question: 7
Given below is the bar graph indicating the marks obtained out of 50 in mathematics paper by 100 students. Read the bar graph and answer the following questions.

(i) It is decided to distribute workbooks on mathematics to the students obtaining less than 20 marks, giving one workbook to each of such students. If a workbook costs Rs. 5, what sum is required to buy the workbooks?
(ii) Every student belonging to the highest mark group is entitled to get a prize of Rs. 10. How much amount of money is required for distributing the prize money?
(iii) Every student belonging to the lowest mark-group has to solve 5 problems per day. How many problems, in all, will be solved by the students of this group per day?
(iv) State whether true or false.
(a) 17% students have obtained marks ranging from 40 to 49.
(b) 59 students have obtained marks ranging from 10 to 29.
(v) What is the number of students getting less than 20 marks?
(vi) What is the number of students getting more than 29 marks?
(vii) What is the number of students getting marks between 9 and 40?
(viii) What is the number of students belonging to the highest mark group?
(ix) What is the number of students obtaining more than 19 marks?
Solution:
(i) The number of students obtaining less than 20 marks is 27 + 12 = 39
Hence, the total cost to buy the work books is 5 × 39 = Rs. 195.
(ii) The highest mark group is 40 – 49. The number of students belonging to this group is 17. Hence, the total amount of money required to distribute the prize money is 10 × 17 = Rs. 170
(iii) The lowest mark group is 0-9. The number of students belonging to this group is 27. Hence, the total number of problems will be solved by the students of this group is 5 × 27 = 135
(iv) The total number of students is 100 (given in the question.
(a) The number of students obtaining marks ranging from 40 – 49 is 17.
The percentage of students belonging to this group is (17/100) × 100 = 17 %
Hence, the statement is true.
(b) The number of students obtaining marks ranging from 10 to 29 is 12 + 20 = 32
Hence, the statement is false.
(v) The number of students getting less than 20 marks is 27 + 12 = 39
(vi) The number of students getting more than 29 marks is 24 + 17 = 41
(vii) The number of students getting marks between 9 to 40 is 12 + 20 + 24 = 56
(viii) The number of students belonging to the highest mark group 40 – 49 is 17.
(ix) The number of students obtaining more than 19 marks is 20 + 24 + 17 = 61
Question: 8
Read the following bar graph and answer the following questions:

(i) What is the information given by the bar graph?
(ii) State each of the following whether true or false.
(a) The number of government companies in 1957 is that of 1982 is 1:9.
(b) The number of government companies has decreased over the year 1957 to 1983.
Solution:
(i) The bar graph represents the number of government companies in India during some years.
(ii) (a) The number of companies in 1957 was 50 and the number of companies in 1982 was 375. Their ratio in that order is 50: 375 = 2: 15
Hence, the statement is false.
(b) The height of the bar graphs increases over the years 1957 to 1983. Hence, the statement is false.
2:15
Question: 9
Read the following bar graph and answer the following questions:

(i) What information is given by the bar graph?
(ii) Which state is the largest producer of rice?
(iii) Which state is the largest producer of wheat?
(iv) Which state has total production of rice and wheat at its maximum?
(v) Which state has total production of wheat and rice at its minimum?
Solution:
(i) The bar graph represents the production of rice and wheat in different states of India.
(ii) According to the height of the bars corresponding to rice, W.B. is the largest producer of rice.
(iii) According to the height of the bars corresponding to wheat. U.P. is the largest producer of wheat.
(iv) U.P. has the maximum total production of rice and wheat, which is 8 + 16 = 24 units
(v) Maharashtra has the minimum total production of rice and wheat, which are exactly 2 + 4 = 6 units.
Question: 10
The following bar graph represents the heights (in cm) of 50 students of Class XI of a particular school. Study the graph and answer the following questions:
 of 50 students of Class XI of a particular school.")
(i) What percentage of the total number of students have their heights more than 149 cm?
(ii) How many students in the class are in the range of maximum height of the class?
(iii) The school wants to provide a particular type of tonic to each student below the height of 150 cm to improve his height. If the cost of the tonic for each student comes out to be Rs. 55, how much amount of money is required?
(iv) How many students are in the range of shortest height of the class?
(v) State whether true or false:
(a) There are 9 students in the class whose heights are in the range of 155-159 cm.
(b) Maximum height (in cm) of a student in the class is 17.
(c) There are 29 students in the class whose heights are in the range of 145-154 cm.
(d) Minimum height (in cm) of a student is the class is in the range of 140-144 cms.
(e) The number of students in the class having their heights less than 150 cm is 12.
(f) There are 14 students each of whom has height more than 154. cm.
Solution:
(i) The total number of students is 50. The number of students having heights more than 149 cm i.e desired percentage is:
⟹ (17 + 9 + 5)/50 × 100
⟹ 62 %
(ii) The maximum range of height is 164 - 165 cm. The number of students belonging to this group is 5.
(iii) The number of students whose heights are less than 150 cm is 7 + 12 = 19. Hence, the total cost is 19 × 55 = Rs.1045/-
(iv) The minimum range of height is 140 – 144 cm. The number of students belonging to this group is 7.
(v) (a) The number of students whose heights are in the range 155 – 159 cm is 9. Hence, the statement is true.
(b) The maximum possible height (in cm) of a student in the class can be 164 cm. Hence the statement is false.
(c) The number of students whose heights are in the range 145 - 154 cm is 12 + 17 = 29. Hence, the statement is true.
(d) The minimum range of heights of students in the class is 140 - 144 cm. Hence, the statement is true.
(e) The number of students having heights less than 150 cm is 7 + 12 = 19. Hence, the statement is false.
(f) The number of students having heights more than 154 cm is 9 + 5 = 14. Hence, the statement is true.
Question: 11
Read the following bar graph and answer the following questions:

(i) What information is given by the bar graph?
(ii) What was the production of cement in the year 1980 – 81?
(iii) What are the minimum and maximum production of cement and corresponding years?
Solution:
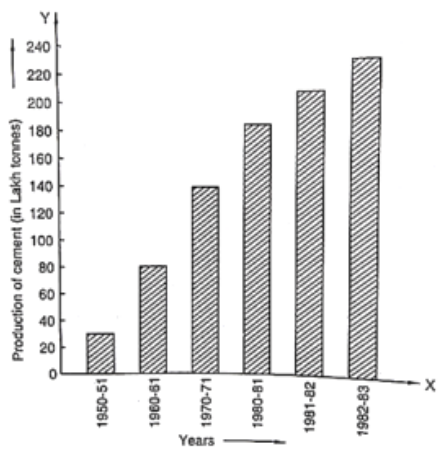
(i) The bar graph represents the industrial production of cement in different years in India.
(ii) According to the height of the 6th bar from the left. the production of cement in the year 1980 – 81 was 186 lakh tonnes.
(iii) According to the heights of the bars. The minimum production of cement is 30 lakh tonnes in the year 1950 – 51 and the maximum production of cement is 232 lakh tonnes in the year 1982 – 83.
Question: 12
The bar graph shown in figure represents the circulation of newspapers in 10 languages.
Study the bar graph and answer the following questions:

(i) What is the total number of newspapers published in Hindi, English, Urdu, Punjabi, and Bengali?
(ii) What percent is the number of newspapers published in Hindi of the total number of newspapers?
(iii) Find the excess of the number of newspapers published in English over those published in Urdu.
(iv) Name two pairs of languages which publish the same number of newspapers.
(v) State the language in which the smallest number of newspapers are published.
(vi) State the language in which the largest number of newspapers are published.
(vii) State the language in which the number of newspapers published is between 2500 and 3500.
(viii) State whether true or false:
(a) The number of newspapers published in Malayalam and Marathi together is less than those published in English.
(b) The number of newspapers published in Telugu is more than those published in Tamil.
Solution:
(i) The total number of news papers published in Hindi, English, Urdu, Punjabi and Bengali is = 3700 + 3400 + 700 + 200 + 1100 = 9100.
(ii) The total number of news papers published is = 1100 + 3400 + 1100 + 3700 + 1400 + 1400 +200 + 1000 + 400 + 700 = 14400.
The number of news papers published in Hindi is 3700. The percentage of published Hindi news papers is (3700/14400) × 100 = 3700/144 = 25.7%
(iii) The number of news papers published in English and Urdu are 3400 and 700 respectively. Hence, the excess of the number of news papers published in English over those published in Urdu is
= 3400 - 700 = 2700
(iv) According to the length of the 5th and 6th bars from the top, the number of news papers published in Marathi and Malayalam are same. According to the length of the 1st and 3rd bars from the bottom, the number of news papers published in Bengali and Gujrati are same.
(v) According to the length of the 4th bar from the top, the smallest number of news papers published in the language Punjabi.
(vi) According to the length of the 4th bar from the bottom, the largest number of news papers published in the language Hindi.
(vii) The languages in which the number of published news papers is greater than or equal to 2500 are English and Hindi. Among the languages Hindi and English, the language in which the number of published news papers is less than or equal to 3500 is English. Hence, the language is English.
(viii) (a) The number of news papers published in Malayalam and Marathi together is 1400 +1400 = 2800 The number of news papers published in English is 3400. Clearly, 2800 is less than 3400. Hence, the statement is true.
(b) The number of news papers published in Telugu and Tamil are 400 and 1000 respectively. Clearly 400 is not greater than 1000. Hence, the statement is false.
Question: 13
Read the bar graph given in and answer the following questions:

(i) What information is given by the bar graph?
(ii) What was the crop-production of rice in 1970 – 71?
(iii) What is the difference between the maximum and minimum production of rice?
Solution:
(i) The bar graph represents the production of the rice crop in India in different years.
(ii) According to the height of the 3rd bar from the left, the crop-production of rice in 1970 – 71 is 42.5 lakh tonnes.
(iii) The maximum product of rice is 55 lath tonnes (height of the 4th bar from the left) in the year 1980 – 81 and the minimum product of rice is 22 lath tonnes (height of the 1st bar from the left) in the year 1950 – 51. Hence, the difference between maximum and minimum production of rice (in lath tonnes) is 55 – 22 = 33
Question: 14
Read the bar graph given in figure and answer the following questions:

(i) What information does it give?
(ii) In which part the expenditure on education is maximum in 1980?
(iii) In which part the expenditure has gone up from 1980 to 1990?
(iv) In which part the gap between 1980 and 1990 is maximum?
Solution:
(i) The bar graph represents the public expenditure on education in different countries and sub continents in the years 1980 and 1990.
(ii) The expenditure on education in Africa in 1980 is the maximum.
(iii) It is clear from the bar graph that in East Africa the expenditure has gone up from 1980 to 1990.
(iv) It is observed from the bar graph that the gap between expenditures in 1980 and 1990 is maximum in Africa, which is 18 -14 = 4 %
Question: 15
Read the graph given in figure and answer the following question
(i) What information is given by the bar given?
(ii) In which years the areas under the sugarcane crop were the maximum and the minimum?
(iii) State whether true or false:
The area under sugarcane crop in the year 1982 – 83 is three times that of the year 1950 – 51.
Solution:
(i) The bar graph represents the areas (in lath hectares) under sugarcane crop during different years in India.
(ii) It is seen from the bar graph that the area under the sugarcane crop is maximum in the year 1982 – 83 and minimum in the year 1950 – 51.
(iii) The area under the sugarcane crop in the years 1982 – 83 and 1950 - 51 are 34 lakh hectares and 18 lakh hectares respectively. Clearly, 34 is not equal to 3 multiplied by 18. Hence, the statement is false.
Question: 16
Read the bar graph given in figure and answer the following questions:

(i) What information is given by the bar graph?
(ii) What was the expenditure on health and family planning in the year 1982-83?
(iii) In which year is the increase in expenditure maximum over the expenditure in the previous year? What is the maximum increase?
Solution:
(i) The bar graph represents the expenditure (in 100 Crores of rupees) on health and family planning during the Sixth Five Year Plan in India.
(ii) The height of the 2nd bar from the left is 7 units, which is corresponding to the year 1982 – 83. Hence, the expenditure on health and family planning in the year 1982 – 83 was 700 Crores rupees.
(iii) Take the year 1980-81 as the initial year of expenditure. Then:
(a) The increase in expenditure in the year 1981- 82 is 5- 4 = 1 unit
(b) The increase in expenditure in the year 1982 – 83 is 7 - 5 = 2 units.
(c) The increase in expenditure in the year 1983 – 84 is 8 - 7 = 1 unit
(d) The increase in expenditure in the year 1984 – 85 is 10.2 - 8 = 2.2 units.
Hence, in the year 1984 – 85 the increase in expenditure is the maximum and the maximum increase is 2.2 × 100 = 220 Cores rupees
Question: 17
Read the bar graph given in figure and answer the following questions:
(i) What is the information given by the bar graph?
(ii) What is the number of families having 6 members?
(iii) How many members per family are there in the maximum number of families? Also tell the number of such families.
(iv) What are the number of members per family for which the number of families are equal? Also, tell the number of such families?

Solution:
(i) The bar graph represents the number of families with the different number of members in a locality.
(ii) The number of families having 6 members is 50, the height of the 6th bar from the left.
(iii) The maximum number of families is 120. There are 3 members per family in the maximum number of families.
(iv) It is seen from the bar graph that the height of the 9th and 10th bars from the left are same (equals to 5). Hence, the numbers of members per family for which the number of families are equal are 9 and 10. The number of such families is 5.
Question: 18
Read the bar graph given in Fig. and answer the following questions:
(i) What information is given by the bar graph?
(ii) Which Door darshan center covers maximum area? Also, tell the covered area.
(iii) What is the difference between the areas covered by the centers at Delhi and Bombay?
(iv) Which Door darshan centers are in U.P. State? What are the areas covered by them?
Solution:
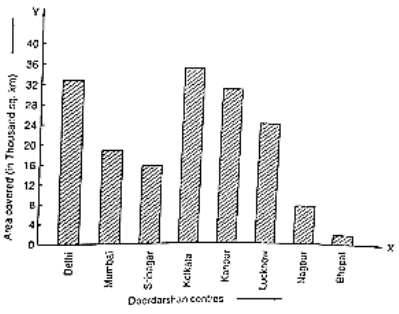
(i) The bar graph represents the area of coverage (in 1000 square km) of some Doordarshan Centers of India.
(ii) It is seen from the bar graph that the height of the 4th bar from the left is maximum, which is corresponding to Kolkata. Hence, the Kolkata Doordarshan covers a maximum area. The area covered by Kolkata Doordarshan is 36 x 1000 = 36000 sq.km
(iii) The area covered by Delhi Doordarshan is 34 x 1000 = 34000 sq.km The area covered by Mumbai Doordarshan is 20 x 1000 = 20000 sq.km Their difference is 34000 – 20000 = 14000 sq. km.
(iv) The Doordarshan centers in Kanpur and Lucknow are in the U.P. state. The area covered by Kanpur Doordarshan is 32×1000 = 32000 sq.km The area covered by Lucknow Doordarshan is 25 x 1000 = 25000 sq.k
View courses by askIITians


Design classes One-on-One in your own way with Top IITians/Medical Professionals
Click Here Know More

Complete Self Study Package designed by Industry Leading Experts
Click Here Know More

Live 1-1 coding classes to unleash the Creator in your Child
Click Here Know More
