Data Handling III (Pictorial Representation of Data as Pie Charts or Circle Graphs) Exercise 25.1
Question: 1
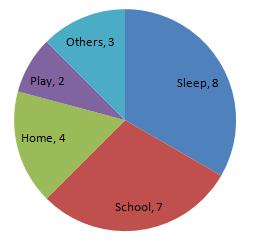
The number of hours, spent by a school boy on different activities in a working day, is given below:
| Activities | Sleep | School | Home | Play | Others | Total |
| Number of hours | 8 | 7 | 4 | 2 | 3 | 24 |
Present the information in the form of a pie-chart.
Solution:
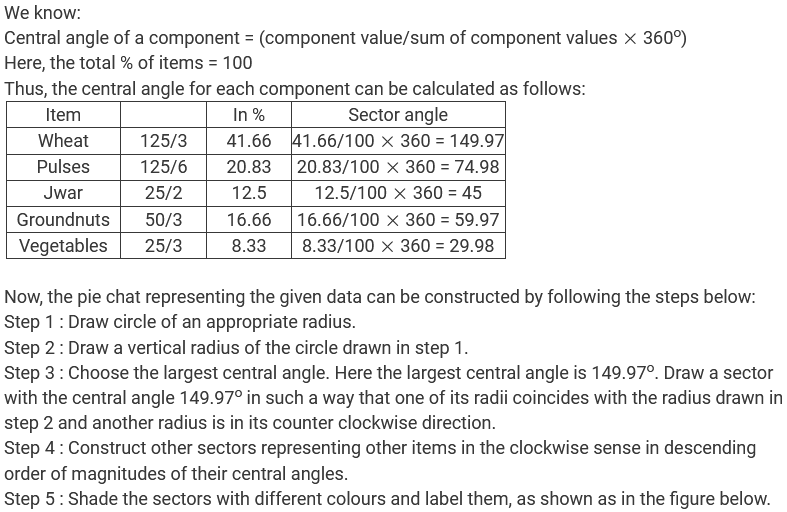
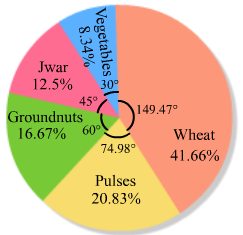
We know:
Central angle of a component = (component value / sum of component values × 360) Here, total number of hours = 24
Thus, the central angle for each component can be calculated as follows:
| Activity | Number of hours | Sector angle |
| Sleep | 8 | 8/24 × 360 = 120° |
| School | 7 | 7/24 × 360 = 105° |
| Home | 4 | 4/24 × 360 = 60° |
| Play | 2 | 2/24 × 360 = 30° |
| Others | 3 | 3/24 × 360 = 45°\ |
Now, the pie chat that represents the given data can be constructed by following the steps given below:
Step 1: Draw a circle of an appropriate radius.
Step 2: Draw a vertical radius of the circle drawn in step 1.
Step 3: Choose the largest central angle. Here, the largest central angle is 120°. Draw a sector with the central angle 120° in such a way that one of its radii coincides with the radius drawn in step 2 and another
radius is in its counter-clockwise direction.
Step 4: Construct other sectors representing other items in the clockwise direction in descending order of magnitudes of their central angles.
Step 5: Shade the sectors with different colours and label them as shown as in the figure below.
Question: 2
Employees of a company have been categorized according to their religions as give
| Religions | Hindu | Muslim | Sikh | Christian | Total |
| Number of workers | 420 | 300 | 22 | 10 | 108 |
Draw a pie-chart to represent the above information.
Solution:
We know:
Central angle of a component = (component value / sum of component values 3
Here, total number of workers = 1050
Thus, the central angle for each component can be calculated as follows:
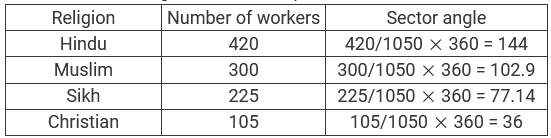
Note: The total number of workers is 1050, not 1080.
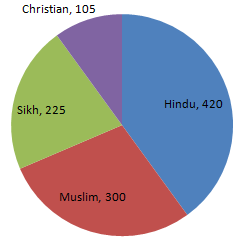
Now, the pie chat that represents the given data can be constructed by following the steps below:
Step 1 : Draw circle of an appropriate radius.
Step 2 : Draw a vertical radius of the circle drawn in step 1.
Step 3 : Choose the largest central angle. Here, the largest central angle is 144o. Draw a sector with the central angle 144o in such a way that one of its radii coincides with the radius drawn in step 2 and another
radius is in its counter clockwise direction.
Step 4 : Construct other sectors representing other items in the clockwise direction in the descending order of magnitudes of their central angles.
Step 5 : Shade the sectors with different colours and label them as shown as in the figure below.
Question: 3
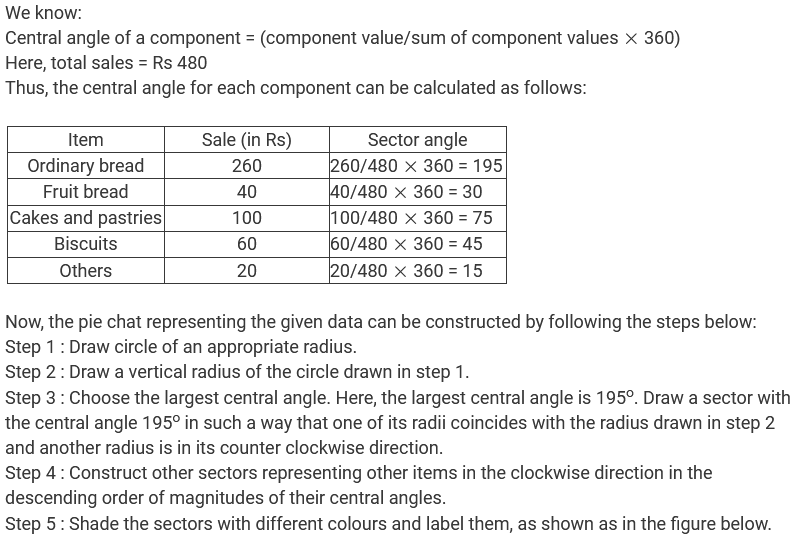
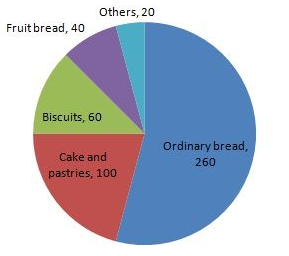
In one day the sales (in rupees) of different items of a baker's shop are given below:
| Items | Ordinary bread | Fruit bread | Cakes and Pastries | Biscuits | Others | Total |
| Sales (in Rs) | 260 | 40 | 100 | 60 | 20 | 480 |
Draw a pie-chart representing the above sales.
Solution:
Question: 4
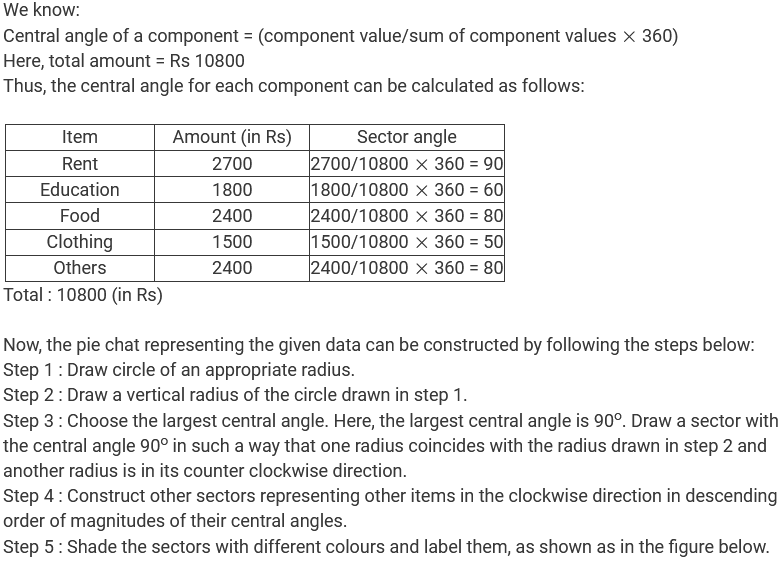
The following data shows the expenditure of a person on different items during a month. Represent the data by a pie-chart.
| Items of expenditure | Rent | Education | Food | Clothing | Others |
| Amount (in Rs) | 2700 | 1800 | 2400 | 1500 | 2400 |
Solution:
Question: 5
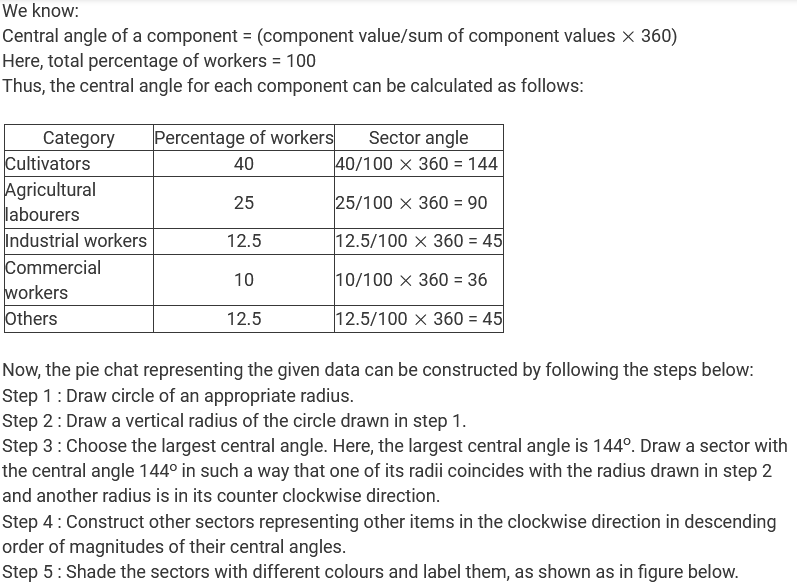
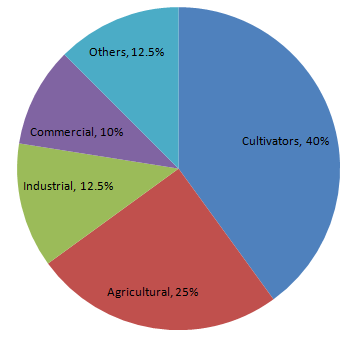
The percentages of various categories of workers in a state are given in the following table.
| Categoies | Culti-vators | Agricultural Labourers | Industrial Workers | Commercial Workers | Others |
| % of workers | 40 | 25 | 12.5 | 10 | 12.5 |
Present the information in the form a pie-chart.
Solution:
Question: 6
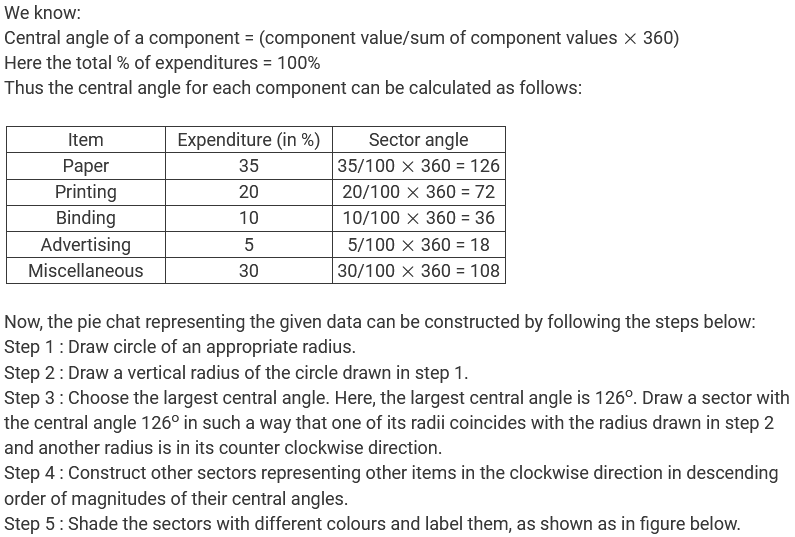
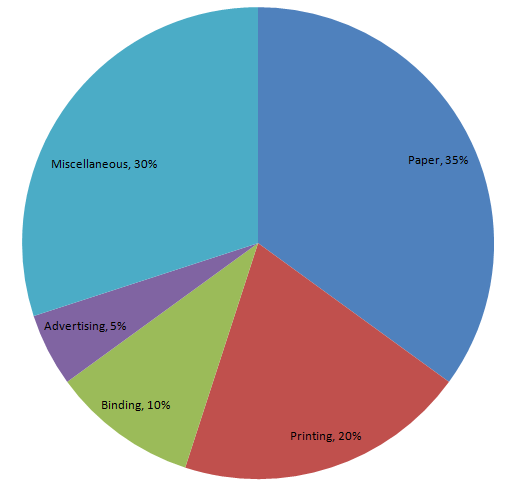
The following table shows the expenditure incurred by a publisher in publishing a book:
| Items | Paper | Printing | Binding | Advertising | Miscellaneous |
| Expenditure (in%) | 35% | 20% | 10% | 5% | 30% |
Present the above data in the form of a pie-chart.
Solution:
Question: 7
Percentage of the different products of a village in a particular district are given below. Draw a pie-chart representing this information.
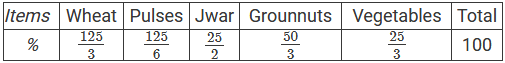
Solution:
View courses by askIITians


Design classes One-on-One in your own way with Top IITians/Medical Professionals
Click Here Know More

Complete Self Study Package designed by Industry Leading Experts
Click Here Know More

Live 1-1 coding classes to unleash the Creator in your Child
Click Here Know More
