Chapter 7: Statistics Exercise – 7.5
Question: 1
Find the mode of the following data:
(i) 3, 5, 7, 4, 5, 3, 5, 6, 8, 9, 5, 3, 5, 3, 6, 9, 7, 4
(ii) 3, 3, 7, 4, 5, 3, 5, 6, 8, 9, 5, 3, 5, 3, 6, 9, 7, 4
(iii) 15, 8, 26, 25, 24, 15, 18, 20, 24, 15, 19, 15
Solution:
(i)
| Value (x) | 3 | 4 | 5 | 6 | 7 | 8 | 9 |
| Frequency (f) | 4 | 2 | 5 | 2 | 2 | 1 | 2 |
Mode = 5 because it occurs the maximum number of times.
(ii)
| Value (x) | 3 | 4 | 5 | 6 | 7 | 8 | 9 |
| Frequency (f) | 5 | 2 | 4 | 2 | 2 | 1 | 2 |
Mode = 3 because it occurs maximum number of times.
(iii)
| Value (x) | 8 | 15 | 18 | 19 | 20 | 24 | 25 | 26 |
| Frequency (f) | 1 | 4 | 1 | 1 | 1 | 2 | 1 | 1 |
Mode = 15 because it occurs maximum number of times.
Question: 2
The shirt size worn by a group of 200 persons, who bought the shirt from a store, are as follows:
| Shirt size: | 37 | 38 | 39 | 40 | 41 | 42 | 43 | 44 |
| Number of persons: | 15 | 25 | 39 | 41 | 36 | 17 | 15 | 12 |
Find the model shirt size worn by the group.
Solution:
| Shirt size | 37 | 38 | 39 | 40 | 41 | 42 | 43 | 44 |
| Number of persons | 15 | 25 | 39 | 41 | 36 | 17 | 15 | 12 |
Model shirt size = 40 because it occurs maximum number of times.
Question: 3
Find the mode of the following distribution. (i)
| Class interval: | 0 – 10 | 10 – 20 | 20 – 30 | 30 – 40 | 40 – 50 | 50 – 60 | 60 – 70 | 70 – 80 |
| Frequency: | 5 | 8 | 7 | 12 | 28 | 20 | 10 | 10 |
(ii)
| Class interval: | 10 – 15 | 15 – 20 | 20 – 25 | 25 – 30 | 30 – 35 | 35 – 40 |
| Frequency: | 30 | 45 | 75 | 35 | 25 | 15 |
(iii)
| Class interval: | 25 – 30 | 30 – 35 | 35 – 40 | 40 – 45 | 45 – 50 | 50 – 55 |
| Frequency: | 25 | 34 | 50 | 42 | 29 | 15 |
Solution:
(i)
| Class interval | 0-10 | 10 – 20 | 20 – 30 | 30 – 40 | 40 – 50 | 50 – 60 | 60 – 70 | 70 – 80 |
| Frequency | 5 | 8 | 7 | 12 | 28 | 20 | 10 | 10 |
Here the maximum frequency is 28 then the corresponding class 40 – 50 is the modal class
l = 40, h = 50 40 = 10, f = 28, f1 = 12, f2 = 20
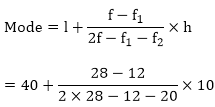
= 40 + 160/ 24
= 40 + 6.67
= 46.67
(ii)
| Class interval | 10 – 15 | 15 – 20 | 20 – 25 | 25 – 30 | 30 – 35 | 35 – 40 |
| Frequency | 30 | 45 | 75 | 35 | 25 | 15 |
Here the maximum frequency is 75, then the corresponding class 20 - 25 is the modal class
l = 20, h = 25 - 20 = 5, f = 75, f1 = 45, f2 = 35
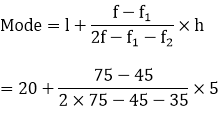
= 20 + 150/70
= 20 + 2.14
= 22.14
(iii)
| Class interval | 25 – 30 | 30 – 35 | 35 – 40 | 40 – 45 | 45 – 50 | 50 – 55 |
| Frequency | 25 | 34 | 50 | 42 | 38 | 14 |
Here the maximum frequency is 50 then the corresponding class 35 - 40 is the modal class
l = 35, h = 40 - 35 = 5, f = 50, f1 = 34, f2 = 42
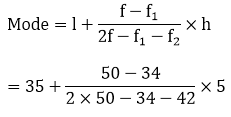
= 35 + 80/24
= 35 + 3.33
= 38.33
Question: 4
Compare the modal ages of two groups of students appearing for an entrance test:
| Age in years | 16 – 18 | 18 – 20 | 20 – 22 | 22 – 24 | 24 – 26 |
| Group A | 50 | 78 | 46 | 28 | 23 |
| Group B | 54 | 89 | 40 | 25 | 17 |
Solution:
| Age in years | 16 – 18 | 18 – 20 | 20 – 22 | 22 – 24 | 24 – 26 |
| Group A | 50 | 78 | 46 | 28 | 23 |
| Group B | 54 | 89 | 40 | 25 | 17 |
For Group A Here the maximum frequency is 78, then the corresponding class 18 – 20 is model class l = 18, h = 20 - 18 = 2, f = 78, f1 = 50, f2 = 46
= 18 + 56/60
= 18 + 0.93
= 18.93 years
For group B Here the maximum frequency is 89, then the corresponding class 18 - 20 is the modal class l = 18, h = 20 - 18 = 2, f = 89, f1 = 54, f2 = 40 Mode
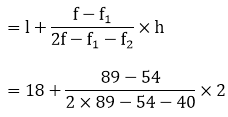
= 18 + 70/84
= 18 + 0.83
= 18.83 years
Hence the modal age for the Group A is higher than that for Group B
Question: 5
The marks in science of 80 students of class X are given below. Find the mode of the marks obtained by the students in science.
| Marks | 0 – 10 | 10 – 20 | 20 – 30 | 30 – 40 | 40 – 50 | 50 – 60 | 60 – 70 | 70 – 80 | 80 – 90 | 90 – 100 |
| Frequency | 3 | 5 | 16 | 12 | 13 | 20 | 5 | 4 | 1 | 1 |
Solution:
| Marks | 0 – 10 | 10 – 20 | 20 – 30 | 30 – 40 | 40 – 50 | 50 – 60 | 60 – 70 | 70 – 80 | 80 – 90 | 90 – 100 |
| Frequency | 3 | 5 | 16 | 12 | 13 | 20 | 5 | 4 | 1 | 1 |
Here the maximum frequency is 20, then the corresponding class 50 – 60 is the modal class l = 50, h = 60 – 50 = 10, f = 20, f1 = 13, f2 = 5
= 50 + 70/22
= 50 + 3.18
= 53.18
Question: 6
The following is the distribution of height of students of a certain class in a city:
| Height (in cm): | 160 – 162 | 163 – 165 | 166 – 168 | 169 – 171 | 172 – 174 |
| No of students: | 15 | 118 | 142 | 127 | 18 |
Find the average height of maximum number of students.
Solution:
| Heights(exclusive) | 160 – 162 | 163 – 165 | 166 – 168 | 169 – 171 | 172 – 174 |
| Heights (inclusive) | 159.5 – 162.5 | 162.5 – 165.5 | 165.5 – 168.5 | 168.5 – 171.5 | 171.5 – 174.5 |
| No of students | 15 | 118 | 142 | 127 | 18 |
Here the maximum frequency is 142, then the corresponding class 165.5 – 168.5 is the modal class l = 165.5, h = 168.5 - 165.5 = 3, f = 142, f1 = 118, f2 = 127
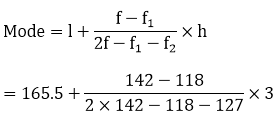
= 165.5 + 72/39
= 165.5 + 1.85
= 167.35 cm
Question: 7
The following table shows the ages of the patients admitted in a hospital during a year:
| Ages (in years): | 5 – 15 | 15 – 25 | 25 – 35 | 35 – 45 | 45 – 55 | 55 – 65 |
| No of students: | 6 | 11 | 21 | 23 | 14 | 5 |
Find the mode and the mean of the data given above. Compare and interpret the two measures of central tendency.
Solution:
We may compute class marks (xi) as per the relation
Now taking 30 as assumed mean (a) we may calculate di and fidi as follows:
| Age (in years) | Number of patients fi | Class marks xi | di = xi – 275 | fidi |
| 5 – 15 | 6 | 10 | - 20 | -120 |
| 15 25 | 11 | 20 | - 10 | -110 |
| 25 35 | 21 | 30 | 0 | 0 |
| 35 45 | 23 | 40 | 10 | 230 |
| 45 - 55 | 14 | 50 | 20 | 280 |
| 55 65 | 5 | 60 | 30 | 150 |
| Total | 80 | 430 |
From the table we may observe that Σfi = 80, Σfi di = 430,
= 30 + 430/80
= 30 + 5.375
= 35.375
= 35.38
Clearly, mean of this data is 35.38. It represents that on an average the age of a patients admitted to hospital was 35.38 years.
As we may observe that maximum class frequency is 23 belonging to class interval 35 – 45
So, modal class = 35 – 45 Lower limit (l) of modal class = 35 Frequency (f) of modal class = 23
Class size (h) = 10 Frequency (f1) of class preceding the modal class = 21 Frequency (f2) of class succeeding the modal class = 14 Mode
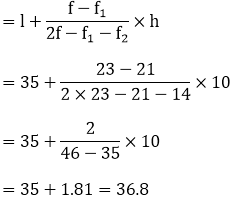
Clearly mode is 36.8. It represents that maximum number of patients admitted in hospital were of 36.8 years.
Question: 8
The following data gives the information on the observed lifetimes (in hours) of 225 electrical components:
| Lifetimes (in hours): | 0 – 20 | 20 – 40 | 40 – 60 | 60 – 80 | 80 – 100 | 100 – 120 |
| No of components: | 10 | 35 | 52 | 61 | 38 | 29 |
Determine the modal lifetimes of the components.
Solution:
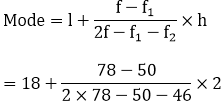
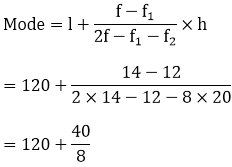
From the data given as above we may observe that maximum class frequency is 61 belonging to class interval 60 – 80
So, modal class limit (l) of modal class = 60 Frequency (f) of modal class = 61 Frequency (f1) of class preceding the modal class = 52
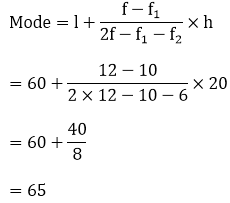
Frequency (f2) of class succeeding the modal class = 38 Class size (h) = 20 Mode
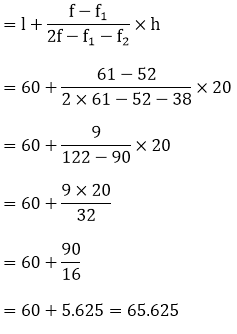
So, modal lifetime of electrical components is 65.625 hours
Question: 9
The following table gives the daily income of 50 workers of a factory:
| Daily income | 100 – 120 | 120 – 140 | 140 – 160 | 160 – 180 | 180 – 200 |
| Number of workers | 12 | 14 | 8 | 6 | 10 |
Find the mean, mode and median of the above data.
Solution:
| Class interval | Mid value (x) | Frequency (f) | fx | Cumulative frequency |
| 100 – 120 | 110 | 12 | 1320 | 12 |
| 120 – 140 | 130 | 14 | 1820 | 26 |
| 140 – 160 | 150 | 8 | 1200 | 34 |
| 160 – 180 | 170 | 6 | 1000 | 40 |
| 180 – 200 | 190 | 10 | 1900 | 50 |
| N = 50 | Σfx = 7260 |
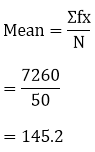
We have, N = 50 Then, N/2 = 50/2 = 25
The cumulative frequency just greater than N/2 is 26, then the median class is 120 - 140 such that l = 120, h = 140 - 120 = 20, f = 14, F = 12
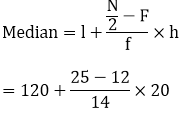
= 120 + 260/14
= 120 + 18.57
= 138.57
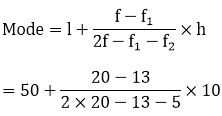
Here the maximum frequency is 14, then the corresponding class 120 - 140 is the modal class l = 120, h = 140 - 120 = 20, f = 14, f1 = 12, f2 = 8
= 120 + 5
= 125
Question: 10
The following distribution gives the state-wise teachers-students ratio in higher secondary schools of India. Find the mode and mean of this data. Interpret the two measures:
| Number of students per teacher | Number of states/ U.T | Number of students per teacher | Number of states/ U.T |
| 15 – 20 | 3 | 35 – 40 | 3 |
| 20 – 25 | 8 | 40 – 45 | 0 |
| 25 – 30 | 9 | 45 – 50 | 0 |
| 30 – 35 | 10 | 50 – 55 | 2 |
Solution:
We may observe from the given data that maximum class frequency is 10 belonging to class interval 30 – 35.
So, modal class = 30 – 35 Class size (h) = 5 Lower limit (l) of modal class = 30 Frequency (f) of modal class = 10 Frequency (f1) of class preceding modal class = 9
Frequency (f2) of class succeeding modal class = 3
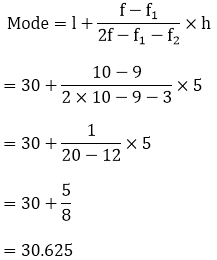
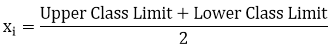
Mode = 30.6 It represents that most of states/ U.T have a teacher- student ratio as 30.6 Now we may find class marks by using the relation Class mark = (upper class limit + lower class limit) /2.
Now taking 32.5 as assumed mean (a) we may calculate di, ui, and fiui as following
| Number of students per teacher | Number of states/ U.T (fi) | xi | di = xi – 32.5 | Ui | fiui |
| 15 – 20 | 3 | 17.5 | -15 | - 3 | - 9 |
| 20 – 25 | 8 | 22.5 | -10 | - 2 | - 16 |
| 25 – 30 | 9 | 27.5 | -5 | - 1 | - 9 |
| 30 – 35 | 10 | 32.5 | 0 | 0 | 0 |
| 35 – 40 | 3 | 37.5 | 5 | 1 | 3 |
| 40 – 45 | 0 | 42.5 | 10 | 2 | 0 |
| 45 – 50 | 0 | 47.5 | 15 | 3 | 0 |
| 50 – 55 | 2 | 52.5 | 20 | 4 | 8 |
| Total | 35 | -23 |
Now,
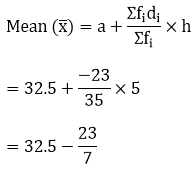
So mean of data is 29.2 It represents that on an average teacher-student ratio was 29.2
Question: 11
Find the mean, median and mode of the following data:
| Classes: | 0 – 50 | 50 – 100 | 100 – 150 | 150 – 200 | 200 – 250 | 250 – 300 | 300 – 350 |
| Frequency: | 2 | 3 | 5 | 6 | 5 | 3 | 1 |
Solution:
| Class interval | Mid value (x) | Frequency (f) | fx | Cumulative frequency |
| 0 – 50 | 35 | 2 | 50 | 2 |
| 50 – 100 | 75 | 3 | 225 | 5 |
| 100 – 150 | 125 | 5 | 625 | 10 |
| 150 – 200 | 175 | 6 | 1050 | 16 |
| 200 – 250 | 225 | 5 | 1127 | 21 |
| 250 – 300 | 275 | 3 | 825 | 24 |
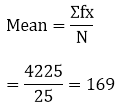
| 300 – 350 | 325 | 1 | 325 | 25 |
| N = 25 | Σfx = 4225 |
We have, N = 25
Then, N/2
= 25/2
= 12.5
The cumulative frequency just greater than N/2 is 16, then the median class is 150 - 200 such that l = 150, h = 200 - 150 = 50, f = 6, F = 10
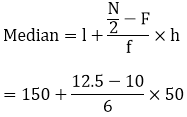
= 150 + 125/6
= 150 + 20.83
= 170.83
Here the maximum frequency is 6, then the corresponding class 150 - 200 is the modal class l = 150, h = 200 - 150 = 50, f = 6, f1 = 5, f2 = 5
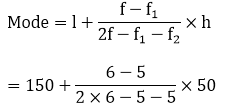
= 150 + 50/2
= 150 + 25
= 175
Question: 12
A students noted the number of cars pass through a spot on a road for 100 periods each of 3 minute and summarized it in the table given below. Find the mode of the data.
Solution:
From the given data we may observe that maximum class frequency is 20 belonging to 40 – 50 class intervals.
So, modal class = 40 – 50 Lower limit (l) of modal class = 40 Frequency (f) of modal class = 20 Frequency (f1) of class preceding modal class = 12
Frequency (f2) of class succeeding modal class = 11 Class size = 10
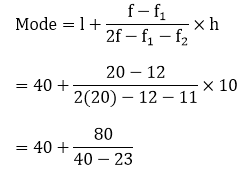
= 40 + 80/17
= 40 + 4.7
= 44.7
So mode of this data is 44.7 cars
Question: 13
The following frequency distribution gives the monthly consumption of electricity of 68 consumers of a locality. Find the median, mean and mode of the data and compare them.
| Monthly consumption: | 65 – 85 | 85 – 105 | 105 – 125 | 125 – 145 | 145 – 165 | 165 – 185 | 185 – 205 |
| No of consumers: | 4 | 5 | 13 | 20 | 14 | 8 | 4 |
Solution:
| Class interval | Mid value xi | Frequency fi | fx | Cumulative frequency |
| 65 – 85 | 75 | 4 | 300 | 4 |
| 85 – 105 | 95 | 5 | 475 | 9 |
| 105 – 125 | 115 | 13 | 1495 | 22 |
| 125 – 145 | 135 | 20 | 2700 | 42 |
| 145 – 165 | 155 | 14 | 2170 | 56 |
| 165 185 | 175 | 8 | 1400 | 64 |
| 185 205 | 195 | 4 | 780 | 68 |
| N = 68 | Σfx = 9320 |
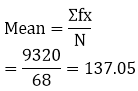
We have, N = 68 N/2 = 68/2 = 34
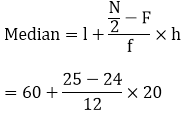
The cumulative frequency just greater than N/2 is 42 then the median class is 125 - 145 such that l = 125, h = 145 - 125 = 20, f = 20, F = 22
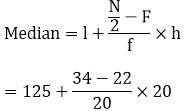
= 125 + 12
= 137
Here the maximum frequency is 20, then the corresponding class 125 - 145 is the modal class l = 125, h = 145 - 125 = 20, f = 20, f1 = 13, f2 = 14
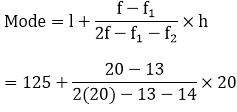
= 125 + 140/13
= 135.77
Question: 14
100 surnames were randomly picked up from a local telephone directly and the frequency distribution of the number of letter English alphabets in the surnames was obtained as follows:
| Number of letters: | 1 – 4 | 4 – 7 | 7 – 10 | 10 – 13 | 13 – 16 | 16 – 19 |
| Number surnames: | 6 | 30 | 40 | 16 | 4 | 4 |
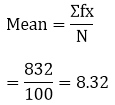
Determine the median number of letters in the surnames. Find the mean number of letters in the surnames. Also, find the modal size of the surnames.
Solution:
| Class interval | Mid value (x) | Frequency (f) | fx | Cumulative frequency |
| 1 – 4 | 2.5 | 6 | 15 | 6 |
| 4 – 7 | 5.5 | 30 | 165 | 36 |
| 7 – 10 | 8.5 | 40 | 340 | 76 |
| 10 – 13 | 11.5 | 16 | 184 | 92 |
| 13 – 16 | 14.5 | 4 | 58 | 96 |
| 16 – 19 | 17.5 | 4 | 70 | 100 |
| N = 100 | Σfx = 832 |
We have, N = 100 N/2 = 100/2 = 50
The cumulative frequency just greater than N/2 is 76, then the median class is 7 - 10 such that l = 7, h = 10 - 7 = 3, f = 40, F = 36
= 7 + 1.05
= 8.05
Here the maximum frequency is 40, then the corresponding class 7 - 10 is the modal class l = 7, h = 10 - 7 = 3, f = 40, f1 = 30, f2 = 16
= 7 + 30/34
= 7 + 0.88
= 7.88
Question: 15
Find the mean, median and mode of the following data:
| Class | 0 - 20 | 20 – 40 | 40 – 60 | 60 – 80 | 80 – 100 | 100 – 120 | 120 – 140 |
| Frequency | 6 | 8 | 10 | 12 | 6 | 5 | 3 |
Solution:
| Class interval | Mid value (x) | Frequency (f) | fx | Cumulative frequency |
| 0 – 20 | 10 | 6 | 60 | 6 |
| 20 – 40 | 30 | 8 | 240 | 17 |
| 40 – 60 | 50 | 10 | 500 | 24 |
| 60 – 80 | 70 | 12 | 840 | 36 |
| 80 – 100 | 90 | 6 | 540 | 42 |
| 100 – 120 | 110 | 5 | 550 | 47 |
| 120 – 140 | 130 | 3 | 390 | 50 |
| N = 50 | Σfx = 3120 |
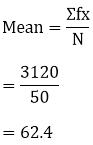
We have, N = 50 Then, N/2 = 50/2 = 25
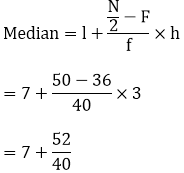
The cumulative frequency just greater than N/2 is 36, then the median class is 60 - 80 such that l = 60, h = 80 - 60 = 20, f = 12, F = 24
= 60 + 20/12
= 60 + 1.67
= 61.67
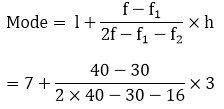
Here the maximum frequency is 12, then the corresponding class 60 - 80 is the modal class l = 60, h = 80 - 60 = 20, f = 12, f1 = 10, f2 = 6
Question: 16
The following data gives the distribution of total monthly household expenditure of 200 families of a village. Find the modal monthly expenditure of the families. Also, find the mean monthly expenditure:
| Expenditure | Frequency | Expenditure | Frequency |
| 1000 – 1500 | 24 | 3000 – 3500 | 30 |
| 1500 – 2000 | 40 | 3500 – 4000 | 22 |
| 2000 – 2500 | 33 | 4000 – 4500 | 16 |
| 2500 – 3000 | 28 | 4500 – 5000 | 7 |
Solution:
We may observe from the given data that maximum class frequency is 40 belonging to 1500 -200 intervals. So, modal class = 1500 -2000
Lower limit (l) of modal class = 1500 Frequency (f) of modal class = 40 Frequency (f1) of class preceding modal class = 24
Frequency (f2) of class succeeding modal class = 33 Class size (h) = 500
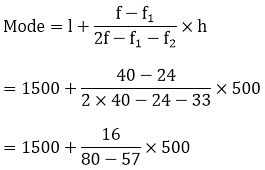
= 1500 + 347.826
= 1847.826
1847.83
So modal monthly expenditure was Rs. 1847.83
Now we may find class mark as Class mark
Class size (h) of given data = 500 Now taking 2750 as assumed mean (a) we may calculate di ui as follows:
| Expenditure (in Rs) | Number of families fi | xi | di = xi – 2750 | Ui | fiui |
| 1000 – 1500 | 24 | 1250 | - 1500 | - 3 | - 72 |
| 1500 – 2000 | 40 | 1750 | - 1000 | - 2 | - 80 |
| 2000 – 2500 | 33 | 2250 | - 500 | - 1 | - 33 |
| 2500 – 3000 | 28 | 2750 | 0 | 0 | 0 |
| 3000 – 3500 | 30 | 3250 | 500 | 1 | 30 |
| 3500 – 4000 | 22 | 3750 | 1000 | 2 | 44 |
| 4000 – 4500 | 16 | 4250 | 1500 | 3 | 48 |
| 4500 – 5000 | 7 | 4750 | 2000 | 4 | 28 |
| Total | 200 | -35 |
Now from table may observe that Σfi = 200, Σfidi = -35
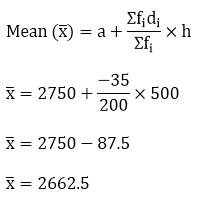
So mean monthly expenditure was Rs. 2662.5
Question: 17
The given distribution shows the number of runs scored by some top batsmen of the world in one day international cricket matches.
| Runs scored | No of batsmen | Runs scored | No of batsmen |
| 3000 – 4000 | 4 | 7000 – 8000 | 6 |
| 4000 – 5000 | 18 | 8000 – 9000 | 3 |
| 5000 – 6000 | 9 | 9000 – 10000 | 1 |
| 6000 – 7000 | 7 | 10000 – 11000 | 1 |
Find the mode of the data.
Solution:
From the given data we may observe that maximum class frequency is 18 belonging to class interval 4000 – 5000.
So, modal class = 4000 – 5000 Lower limit (l) of modal class = 4000
Frequency (f) of modal class = 18. Frequency (f1) of class preceding modal class = 4 Frequency (f2) of class succeeding modal class = 9 Class size (h) = 1000. Now
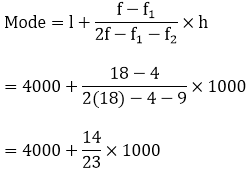
= 4000 + 608.695
= 4608.695
So mode of given data is 4608.7 runs
View courses by askIITians


Design classes One-on-One in your own way with Top IITians/Medical Professionals
Click Here Know More

Complete Self Study Package designed by Industry Leading Experts
Click Here Know More

Live 1-1 coding classes to unleash the Creator in your Child
Click Here Know More
