Inequalities
Table of Content |
What is Inequality?
 Generally the word inequality is used for the disparity between the color, caste and other social issues. And the meaning of the inequality is the relation between any two things or people which shows that they are not equal in any way.
Example
-
Some people are rich, some are poor.
-
Some countries are wealthy, some are relatively poor.

What is the Inequality in math?
In mathematics, if two values are not equal, then also there is a relation between them and that relation is called inequality. Inequality means not equal, for which we use a not equal sign that is “≠”. Inequalities within two real numbers are called Numerical Inequalities.
Example
5 ≠ 7 (5 is not equal to 7)
This shows that two numbers are not equal but it does not tell that whether it is less than or greater than. If we have to compare something then we use other inequality symbols.
Inequality symbol
For the things which are equal we use a “=” that is, “equal sign” but for the things which are not equal to each other, we use different signs.
- Strict Inequality: If we have to compare the integers or real numbers then we use some inequality symbols like:
r > s (r is greater than s)
r < s (r is less than s)
These are called Strict Inequalities as it says that these numbers are strictly less or greater than each other but not equal to them
Example
It reads as 25 is strictly less than 30 but not equal to it.
- Slack Inequality: There are two more inequality symbols also which shows the relation between inequalities which are not strict.
r ≥ s (r is greater than or equal to s)
r ≤ s (r is less than or equal to s)
What is an Inequality in algebra?
Algebra is the study of elementary equations solving. So the inequality in algebra is the mathematical statement which shows the relation between two expressions using inequality symbols. The relation between two algebraic expressions with inequality symbols is called literal Inequalities.
-
x>y, It implies that x is greater than y where x and y are two variables.
-
x<y, It implies that x is less than y.
-
x≥y, It implies that x is greater than or equal to y.
-
x≤y, It implies that x is less than or equal to y.
-
If an inequality contains only one variable then it is called open sentence.
-
Example
x>-5 (x is greater than -5)
y≤7 (y is less than or equal to 7)
These are having only one variable.
- If a statement shows the double relation of the numbers or expressions then it is called double inequalities.
Example
4 < 6 < 8 (read as 6 is greater than 4 and less than 8),
4 ≤ y < 6 (read as y is greater than or equal to 4 and less than 6)
Properties of Inequality
1. Addition and Subtraction Property
2. Multiplication and Division Property
3. Transitivity Property
4. Converse Property
1. Addition and Subtraction Property
Adding or subtracting a constant number to the both sides of inequality gives the same result or equivalent to each other.
Addition
Subtraction
-
If x ≤ y, then x − c ≤ y − c
-
If x ≥ y, then x − c ≥ y – c
2. Multiplication and Division Property
If we multiply or divide with a constant positive number to the both sides of inequality then the inequality will remain same, but if we divide or multiply with a negative number then the inequality will get reversed.
Multiplication
-
If we multiply both sides with c which is positive:
-
If x ≥ y and c > 0, then xc ≥ yc
-
If x ≤ y and c > 0, then xc ≤ yc
-
-
If we multiply both sides with c which is negative
-
If x ≥ y and c < 0, then xc ≤ yc
-
If x ≤ y and c < 0, then xc ≥ yc
-
Division
-
If we divide both sides with c which is positive:
-
If we divide both sides with c which is negative
-
If x ≥ y and c < 0, then x/c ≤ y/c.
-
If x ≤ y and c < 0, then x/c ≥ y/c.
-
3. Transitivity Property
This property shows relation between three numbers.
In the above relation if one is strict inequality then the final result we also be strict inequality.
-
if x ≥ y and y > z, then x > z
4. Converse Property
This property says that if we flip the numbers then we have to flip the sign of inequality also.
What is the difference between Linear Equations and Inequalities?
The major difference is there symbol that is, “=” sign in equation and <,> ≤, ≥ and ≠ sign in inequalities.
Linear Equation
Linear equation is basically an equation of line. It could be in one variable or two. If we have an equal sign in a statement then it is an equation.
Examples
x = 5
y = 2x + 1
This shows that there is one constant term in it and one term multiplied with other variable which tells the slope of the line.
But if there is an exponent or roots in an equation then this is not a linear equation.
-
Graph of Linear Equation: Linear equation can be represented on the coordinate plane as a line using the solution set of the given equation.
Example
Draw a graph of the linear equation y = 3x + 1.
Solution:
- First we have to solve the equation for the solution set to find the coordinates of the line.
y = 3x + 1
Let x = 0, y = 3(0) +1 = 1(0, 1)
x = 1, y = 3(1) + 1 =4 (1, 4)

Linear Inequality
Linear Inequality is the inequality in an equation having linear function. It is same as linear equations just replacing the equality sign with the inequality symbols. To find the solution of the inequalities, first we need to solve them as linear equations. All the methods and properties of solving linear equations and inequalities are same.
y>x+1 (linear inequality having greater than sign)
- Linear inequality in one variable: If there is only one variable in a linear function then it is linear inequality with one variable.
Example
5x < 100
There is only one variable “x” in the above linear function.
- How can you solve an inequality in one variable?
Both the linear equation and inequality has the same method to solve it.
Let’s understand it with the example:
Given: 5x < 100
We can solve it by putting values to x assuming x = 0, 1, 2 and so on.
x =0, 0<100, this is true
x =1, 5<100, this is true
x = 2, 10<100, this is true
x = 3, 15<100, this is true
x = 4, 20<100, this is true
Like this we can get the solution set of this inequality by putting values for x, but this is not possible for the bigger numbers. And it is time consuming also.so we can use the properties of inequalities to solve it as discussed above in the properties of inequalities.
Example
Solve 4x + 5 < 6x + 9
Solution: We can subtract 6x from both the sides.
4x – 6x < 6x + 4 – 6x
- 2x < 4
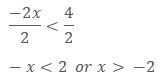
As if we flip the sign the sign of inequality should also be flipped.
The solution set here is (-2, ∞) which says the set of all the real numbers greater than:
How do you graph an inequality on a number line?
In the case of one variable the graph of linear inequality will be a number line only. The process is similar to the plotting a number on the number line.
Strict Inequality: If there is an inequality with < and > sign, then we will use the open circle or a not filled circle to represent it, which shows that, the particular number is not included in the solution.
Example 1
Draw a graph for x> -2
-
First draw a number line.
-
Then we will plot a point for x = -2 on the number line.
-
Mark it with an open circle as the -2 is not included in the solution.
-
As the inequality sign shows that x> -2, so we will shade the line to the right side.

Example 2
Draw a graph for x < -2
Here the process will remain same just the part of shading will change. Here we will shade line to the left as it says that x < -2.

Slack Inequality: If there is an inequality with ≤ and ≥ sign, then we will use the close circle or filled circle to represent it, which shows that the particular number is included in the solution.
Example 1
Draw a graph for x ≥ 2
-
First draw a number line.
-
Then we will plot a point for x=2 on the number line.
-
Mark it with a closed circle as the 2 is included in the solution.
-
As the inequality sign shows that x≥ 2, so we will shade the line to the right side.

Example 2
Draw a graph for x ≤ 2
Here the process will remain same just the part of shading will change. Here we will shade line to the left as it says that x ≤ 2.

- Linear inequality in two variables: If there are two variables in a linear function then it is linear inequality with two variables.
Example
x + 3y < 9
There are two variables x and y in this linear inequality.to find the value of one variable we must know the value of other variable.
How to solve a linear inequality with two variables?
We will solve the linear inequality, with the same method of solving linear equations.
We can assume the value of x as 0, 1, 2 and so on. So that we can find the solution set for the given problem.
Example
Solve x + 9y < 27 for the solution set.
Solution: We will find the pair of values of x and y for the solution set.
Let x = 0
0 + 9y < 27
9y < 27
y < 3
This shows that if x = 0 then y could be less than 3 that is, 0, 1, 2. We will not include 3 here as it is less than three only not less than or equal to three. The solution set for this are-
0, 0), (0, 1), (0, 2).
All the point coordinates of these ordered pairs will come in the solution part.
Similarly we can find the solution set by assuming the value of x as 1, 2, 3 and so on.
Graph of Linear Inequality in two variables
The solution of the linear inequality with two variables is represented by the half plane on the Euclidean plane.
Example
Draw graph for y≤ x + 2
 Solution
-
First of all we will solve the equation as the linear equation with equality sign to find the solution.
If x = 0 then y = 2
y = 0 then x = – 2
-
Then we will draw a line on the graph using the solution set that is, (0, 2) and (-2, 0). Joining these two points we will get the line of our equation.
-
Now we have to find the solution of the inequality. if there is ≥ and ≤ sign then we will make a solid line which shows that the line is included in the solution or a dashed line for < and > sign which shows that the line is not included in the solution.
-
After plotting the line we will shade the lower region that is, below the line for < or ≤ sign or the upper region that is, above the line for > or ≥ sign.
-
That shaded part is the solution of the given linear inequality.
More Readings
To read more, Buy study materials of Set Relations and Functions comprising study notes, revision notes, video lectures, previous year solved questions etc. Also browse for more study materials on Mathematics here.
View courses by askIITians


Design classes One-on-One in your own way with Top IITians/Medical Professionals
Click Here Know More

Complete Self Study Package designed by Industry Leading Experts
Click Here Know More

Live 1-1 coding classes to unleash the Creator in your Child
Click Here Know More
