
Grade 12th passMechanics
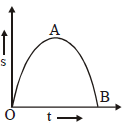
what will be the velocity time graph of corresponding figure
what will be the velocity time graph of corresponding figure


Three identical balls are placed on a frictionless
horizontal surface touching each other. They stick to
each other because of adhesive. Another ball of same
radius and mass m is placed over the void created by
the three balls. Find the forces applied by the balls
kept on the floor to each other if the system remains
in equilibrium.
Last Activity: 9 Months ago
A car loaded with water having total mass 1000 kg moves on a straight horizontal Road starting from rest under the action of a force of 100 Newton. The water spills throw a small hole in the bottom at a rate of 0.1 KG per second the velocity of cart after 300 seconds is nearly.
11
21
31
41
Last Activity: 10 Months ago
Last Activity: 3 Years ago
Last Activity: 3 Years ago