(a)
The graph of x versus t for particle moving in a straight line is shown in the figure below:

In the region OA, the graph is a straight line, and therefore the change of position with time (velocity) will remain constant but positive. However, the acceleration given by the change of velocity over time will be equal to zero.
In the region AB, the distance increases with time initially but tries to saturate lately to a constant value. Therefore the change of distance over time should be a straight line with a negative slope. However, the acceleration given by the slope of the straight line will be a constant negative value.
In the region BC , the for x versus t attains a constant value. This ensures that the change of distance x over time (velocity) remains zero. The acceleration, defined as the rate of change of velocity, will also be equal to zero.
In the region CD, the x versus t is a curve such that its slope decreases over time. Therefore the velocity versus time graph should be represented by a ‘straight line. Acceleration on the other hand will remain constant and has a negative value
The velocity versus time graph is shown below:
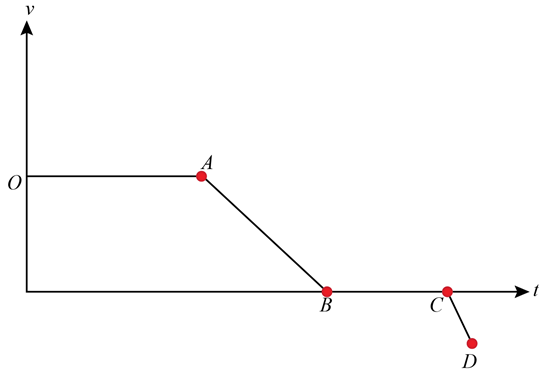
It can be seen from the graph above that the velocity is negative in region CD, positive in region OA and AB while zero in interval BC.
The acceleration versus time graph is shown below:
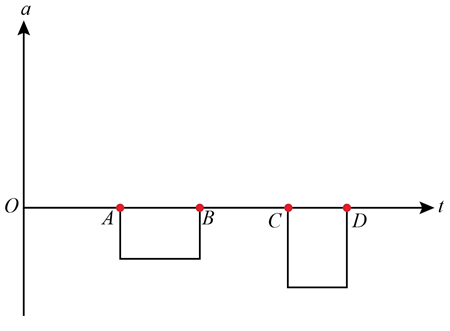
It can be seen in from the graph above that the acceleration is negative in interval AB and CD, and is zero in interval OA and BC.
(b)
It can be seen from the graphs above that there is no interval in which the acceleration is note constant. The acceleration either attains a constant negative value of remains zero in the interval.


