

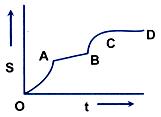
Mach the following as per the figure attached below and also “EXPLAIN” hw to do Column IColumn II(a)OA(p)Velocity increase with time linearly(b)AB(q)Velocity decreases with time(c)BC(r)Velocity is independent of time(d)CD(s)Velocity is zero

Mohammad Kavish , 9 Years ago
Grade Select Grade


