
Algebra
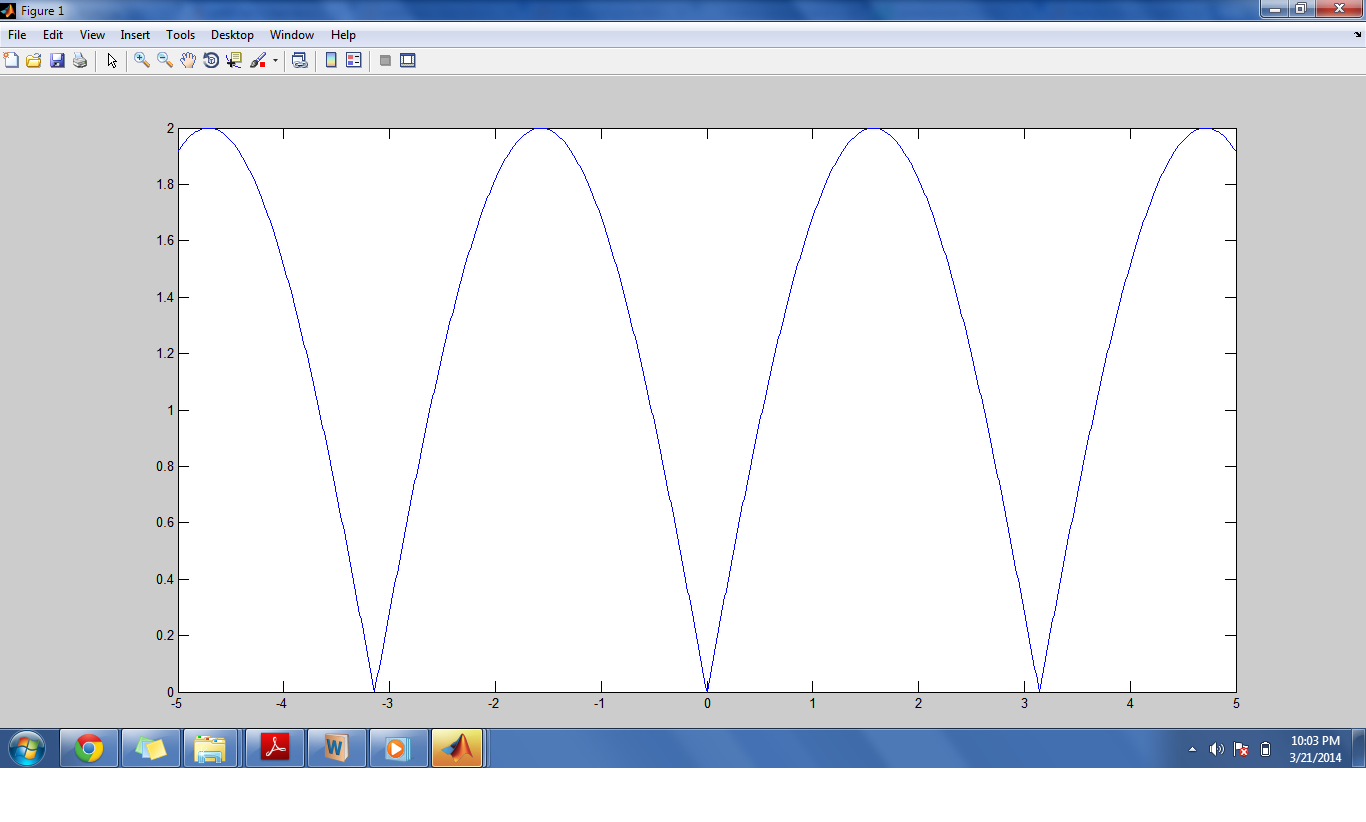
1.Find the range of |sinx|+|cosx|
and how to draw a graph of it by some method
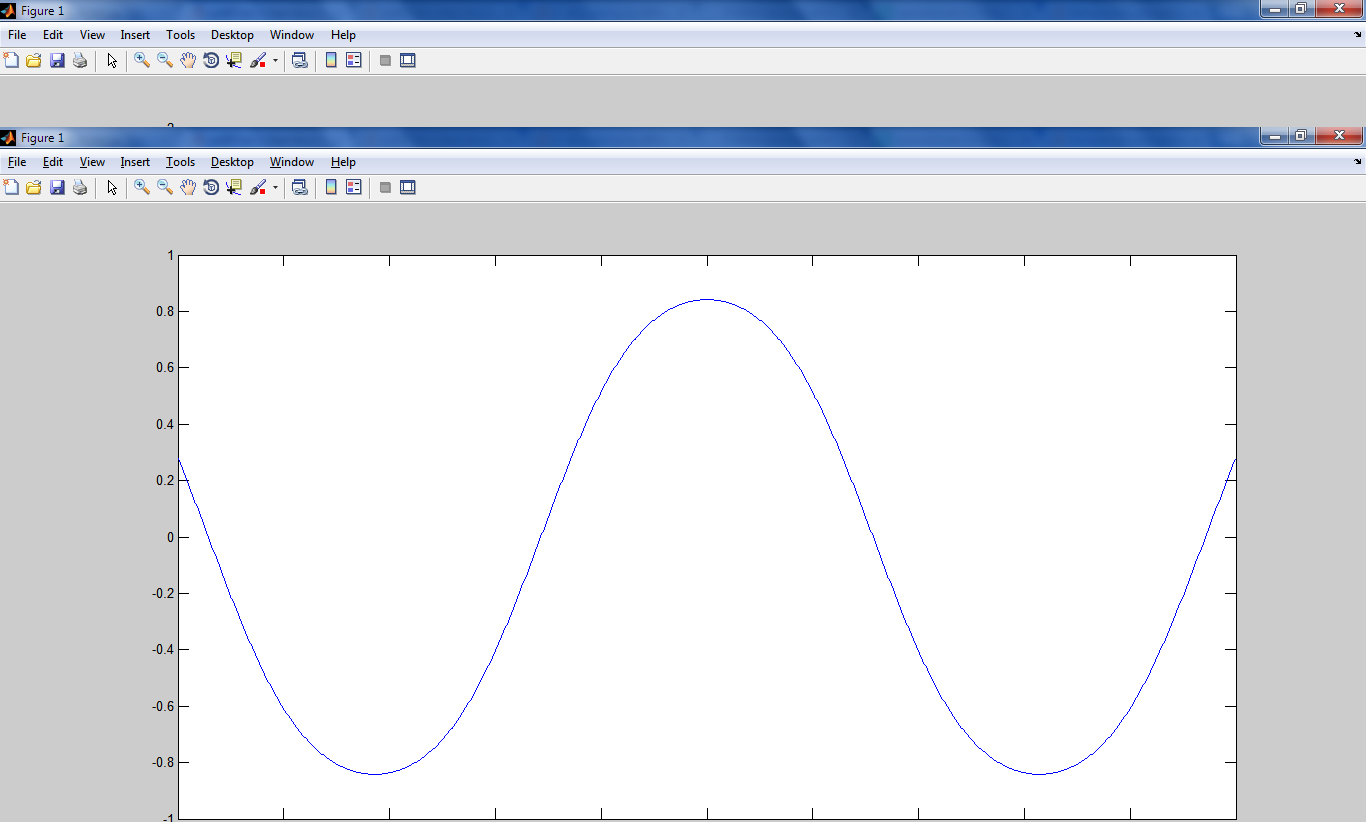
2. How to draw a graph of sin(cos(x))


Last Activity: 2 Years ago