Algebraic Solutions of Linear Inequalities in One Variable and their Graphical Representation
Table of Content |
Linear Inequality
Linear Inequality is the inequality in an equation having linear function. It is the relation between two algebraic expressions represented with inequality symbols. It is same as linear equations just replacing the equality sign with the inequality symbols.
y = 2x + 1 (linear equation having equal sign)
y > 2x + 1 (linear inequality having greater than sign)
Symbols of Linear Inequality

For the expressions which are not equal to each other we use “≠” means “is not equal to “symbol but it does not tell the comparison, whether it is less or more. So, for the comparisons we use following symbols:
x < 5 read as x is less than 5.
x > 5 read as x is greater than 5.
The above two are called Strict Inequalities as they shows that the number is strictly less or more than the other number tha is, the value is not included in the solution.
y ≤ 7 read as y is less than or equal to 7.
y ≥ 7 read as y is greater than or equal to 7.
These two are called Slack Inequality or non-strict inequality as they show that the value is included in the solution.
Linear Inequality in one variable
If there is only one variable in a linear function then it is linear inequality in one variable.
Example
3x < 27
There is only one variable “x” in the above linear function.
Linear inequality in two variables
If there are two variables in a linear function then it is linear inequality in two variables.
Example
x + 3y < 9
There are two variables x and y in this linear inequality to find the value of one variable we must know the value of other variable.
Algebraic Solutions of Linear Inequalities in One Variable
Let’s understand it with the example
Mary has Rs. 50 to buy toys and the cost per toy is Rs. 15. How much toys can she buy with her money?
First we need to write the inequality for the problem. As x is the number of toys so it cannot be negative or fraction.
15x ≤ 50
Now we will try to solve it with the trial and error method.
Solution
This shows that the above inequality is true when the values of x are 0, 1, 2 and 3. So these values of x are the solution of the above inequality.
The solution of an inequality of one variable is the value of the variable which makes it a true statement.
Solution Set
Solution Set is the set containing all the values of the variable which makes it a true statement. As in the above example the solution set of the inequality is x = {0, 1, 2, 3}
Rules to solve a Linear Inequality in one variable
Both the linear equation and inequality are different from one another by their sign of equality or inequality.so we can apply the process of solving a linear equation to the linear inequality also.
In the above example, we got the solution set of the inequality by putting values for x, but this is not possible for the bigger numbers. And it is time consuming also.so we can use the other two methods like-

-
Adding or subtracting same number to the both sides of the linear inequality without changing the sign of inequality.
Example
x + 5 <20
Here we can solve it by subtracting same number i.e. 5 to the both sides of inequality.
x + 5 – 5 < 20 – 5
x < 15
Hence the solution of the inequality is the value of x which is less than 15 as it makes the statement of inequality true.
-
Multiply or divide with the same positive number to the both sides of inequality keeps the sign of inequality remains same. But if we multiply or divide both sides with the negative number then the sign of inequality get reversed.
Example
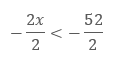
2x < 52
Here we will divide both sides with 2.

x < 26
Hence the solution is the value of x which is less than 26.
If we will divide it with -2 then the sign of inequality will get reversed. Like:
- x < -26
X > 26 (as the sign of inequality get reversed).
Steps for solving inequalities in one variable
Inequalities in one variable can be solved using the above rules of inequality in one step or two steps, depends upon the requirement of the inequality.
Solving one-step inequality: It is easy to solve one step inequality with any of the above property.
Example
Solve

Here we can use the property of multiplication. Multiply both sides with 3.
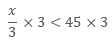
x <135
This shows that the value of x is less than 135 which makes this statement true.
Let’s check:
Let x = 27

9 < 45
Hence, it proves that our answer is correct.
Solving two-step inequality: The process of solving the two-step inequality is just same as equations, so we need to manipulate the inequalities properties so that it separates the variable to the one side.
Example
Solve the inequality 4x-4 ≥ 10.
We just have to use the right property to solve it.
| Solve | 4x – 4 ≥ 10 |
| 4x – 4 + 4 ≥ 10 + 4 | Add 4 to the both sides |
| 4x ≥ 14 | Solving both sides |
| 4x/4 ≥ 14/4 | Divide both sides with 4 |
| x ≥ 7/2 or 3.5 | The solution. |
Check
If x is greater than or equal to 3.5 then we can check it with any number greater than this.
4(5) – 4 ≥ 10
20 – 4 ≥ 10
16 ≥ 10
Hence, this solution is correct.
Graphical representation of Linear Inequalities in One Variable
Graph is the representation of the solution of the linear inequality on the Euclidean plane.
In the case of one variable the graph of linear inequality will be a number line only. There is only one variable so it will be represented on one line only. The process is like plotting a number on the number line.
Step of graphing a solution on a number line:
-
First we need to solve the inequality using the rules of inequality to find the solution.
-
Make a number line.
-
Plot the point on the number line.
-
Use the open circle to represent the strict inequality that is, < (less than) and > (greater than), which indicates that the point on the number line is not included in the range of the solution of the inequality.
-
Closed or filled circle to represent the slack inequality tha is, ≤ (less than or equal to) and ≥ (greater than or equal to), which represents that the point on the number line is included in the range of the solution of the inequality.
-
-
Now shade the number line according to the sign of inequality.
-
For < and ≤, shade to the left of the point on the number line.
-
For > and ≥, shade to the right of the point on the number line.
-
The shaded portion on the number line represents the range of the true values for the inequality.
Example

1. Graph of x ≥ 3.
It is slack inequality so it is marked with closed circle. It is shaded to the right as it is greater than sign. [3, ∞) this interval notation shows that number 3 is included in the solution.
2. Graph of x > 3.
It is strict inequality so it is marked with open circle. It is shaded to the right as it is greater than sign. (3, ∞) this interval notation shows that number 3 is not included in the solution.
It is slack inequality so it is marked with closed circle. It is shaded to the left as it is less than sign. (-∞, 6] this interval notation shows that number 6 is included in the solution.
4. Graph of x < 6.
It is strict inequality so it is marked with open circle. It is shaded to the left as it is less than sign. (-∞, 6) this interval notation shows that number 6 is not included in the solution.
Word Problems
Example: 1
Solve 6(x – 2) + 4 >4(2x – 3) and check your answer. Show the solution on the graph.
Solution:
6(x – 2) + 4 > 4(2x – 3).
6x – 12 + 4 > 8x-12 (simplify the equation)
6x – 8 > 8x – 12
6x – 8 – 6x > 8x -12 -6x (subtracting both sides with 6x)
- 8 >2x -12
4 > 2x
2 > x
x < 2
The solution set for this inequality is (-∞, 2)
Check
Let x = 1
6(x – 2) + 4 >4(2x – 3)
6(1 – 2) + 4 > 4(2(1) – 3))

6(-1) +4 > 4 (-1)
-6 +4 > -4
-2 > -4
This is a true statement.
The graphical representation of the solution on the right side.
Example: 2
Ben obtained 60 and 65 marks in first two terms in mathematics. Find the minimum marks he should get in the third term to have an average of at least 70 marks.
Solution:
Let x be the marks obtained by Ben in third term in mathematics, then
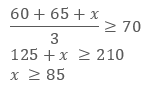
Hence, Ben must score 85 marks in third term in math to get the average of 70 marks.
Example: 3
Karim has a packet of balloons which has 500 balloons. He sells 25 balloons daily. He wants to save at least 200 balloons at the end to decorate in a birthday party.
1. Write an inequality to represent the above problem.
2. How many days can he sell balloons from that packet?
3. Represent your solution on a number line.
Solution:
1. Let the number of days = d
So the inequality will be:
500 – 25d ≥ 200
2. Solving the inequality.
| Solve | 500-25d ≥200 |
| 500 – 500 - 25d ≥ 200 – 500 | subtract both sides with 500 |
| - 25d ≥ – 300 | simplify the equation |
| - 25d/25 ≥ - 300/25 | divide both sides with 25 |
| - d ≥ – 12 | Simplify the equation |
| d ≤ 12 | Inverse property |
So the numbers of days for which he can sell balloons are 12.
3. Graphical representation of the solution.
As d is the number of days so it cannot be in negative. The number line of the solution is as follows:

More Readings
Algebraic Solutions of Linear Inequalities in One Variable and their Graphical Representation
View courses by askIITians


Design classes One-on-One in your own way with Top IITians/Medical Professionals
Click Here Know More

Complete Self Study Package designed by Industry Leading Experts
Click Here Know More

Live 1-1 coding classes to unleash the Creator in your Child
Click Here Know More
